

Question: Using Python or Matlab: For the function f = cos(4x). (1) Plot graph of the exact solution (2) Plot graph of its interpolation. Use n
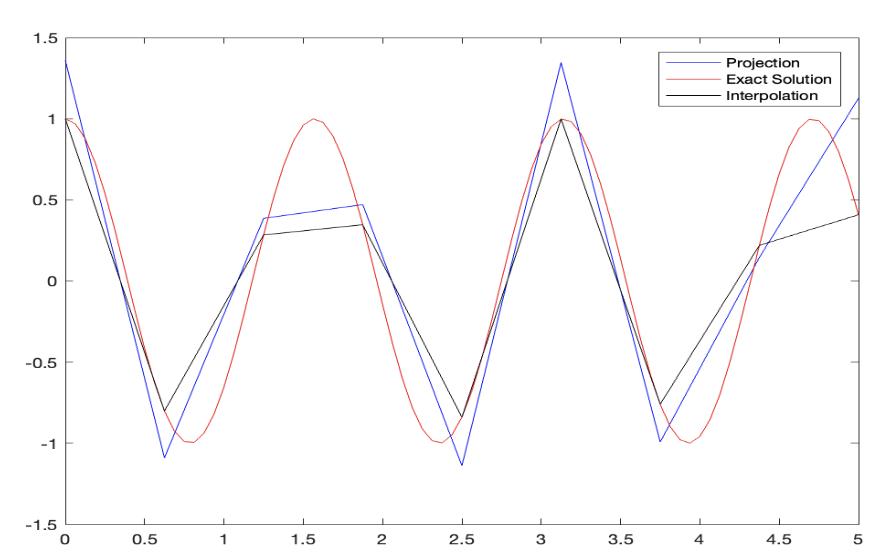
Using Python or Matlab: For the function f = cos(4x). (1) Plot graph of the exact solution (3) Plot graph of its L2 projection. Use n = 8 (8 subintervals). Use the Trapezoidal Rule and the Simpsons Rule. Graphs must look like this.
(2) Plot graph of its interpolation. Use n = 8 (8 subintervals). T=5.
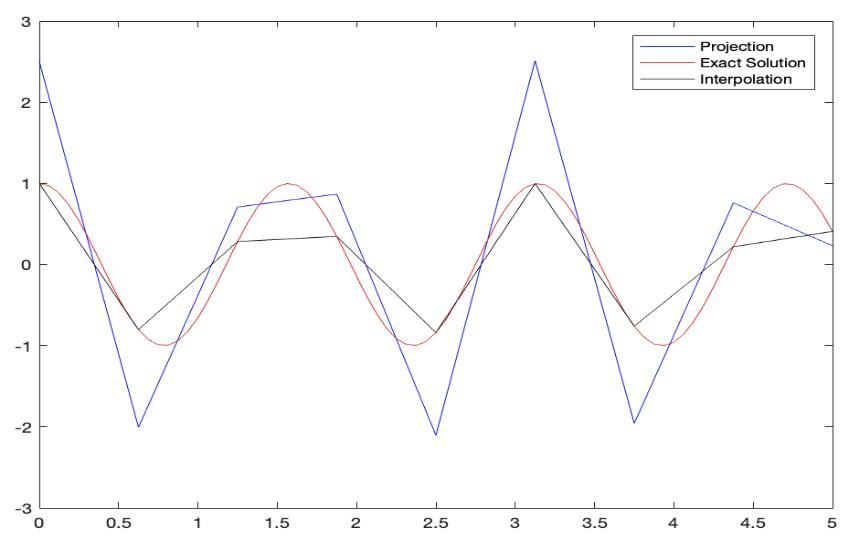
2 0 -2 -3 0.5 1 1.5 2 2.5 3 3.5 + Projection Exact Solution Interpolation 4.5 50
Step by Step Solution
★★★★★
3.42 Rating (146 Votes )
There are 3 Steps involved in it
1 Expert Approved Answer
Step: 1 Unlock

Question Has Been Solved by an Expert!
Get step-by-step solutions from verified subject matter experts
Step: 2 Unlock
Step: 3 Unlock