

Question: Using Python please This example reads a text file collected from a GPS unit. The lines in the file represent readings taken from the GPS
Using Python please
This example reads a text file collected from a GPS unit. The lines in the file represent readings taken from the GPS unit as the user traveled along an ellipsoidal path. The latitude and longitude are given; the column with header "log" is a random number associated with the time at which the gps recording was made . Write a Python function drawGPS() that reads in the text file, returns nothing, and plots an animation of the user's path using the Turtle module (i.e. plots the latitute and longitude at each time/line).
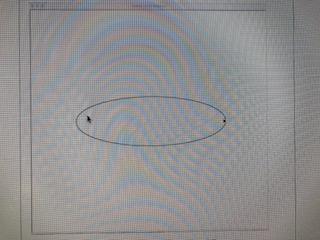
The file for this example is called racetrack_gps.txt and it looks something like the text string shown in the image below.
(A picture of the text file and what the image should look like.)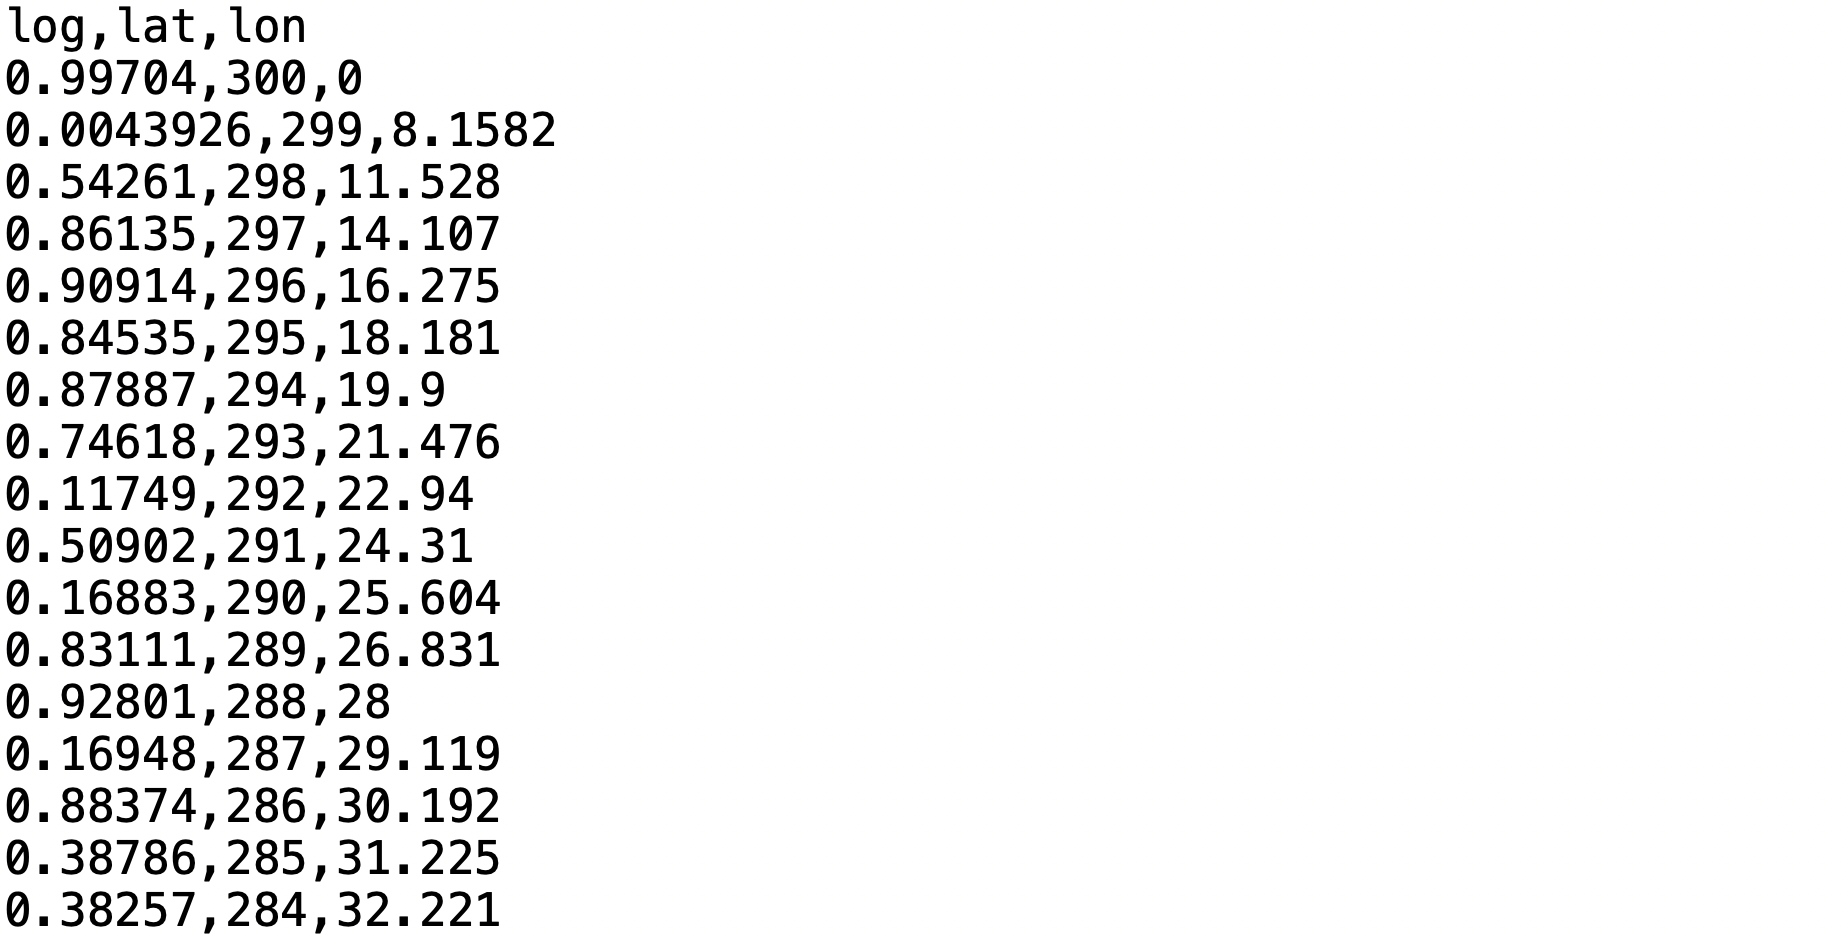
log, lat, lon 0.99704,300,0 0.0043926,299,8. 1582 0.54261, 298, 11.528 0.86135, 297, 14. 107 0.90914,296,16.275 0.84535,295, 18. 181 0.87887, 294,19.9 0.74618,293,21.476 0.11749, 292,22.94 0.50902,291, 24.31 0.16883, 290, 25.604 0.83111, 289, 26.831 0.92801, 288, 28 0.16948, 287, 29. 119 0.88374,286, 30. 192 0.38786, 285, 31.225 0.38257,284,32.221
Step by Step Solution
There are 3 Steps involved in it

Get step-by-step solutions from verified subject matter experts