

Question: USING PYTHON TO DO THIS ASSIGNMENT SORRY I COULDN'T ATTACH EXCEL FILE , COULD YOU PLEASE USE THE DATA IN THE PICS TO SOLVE THIS
USING PYTHON TO DO THIS ASSIGNMENT
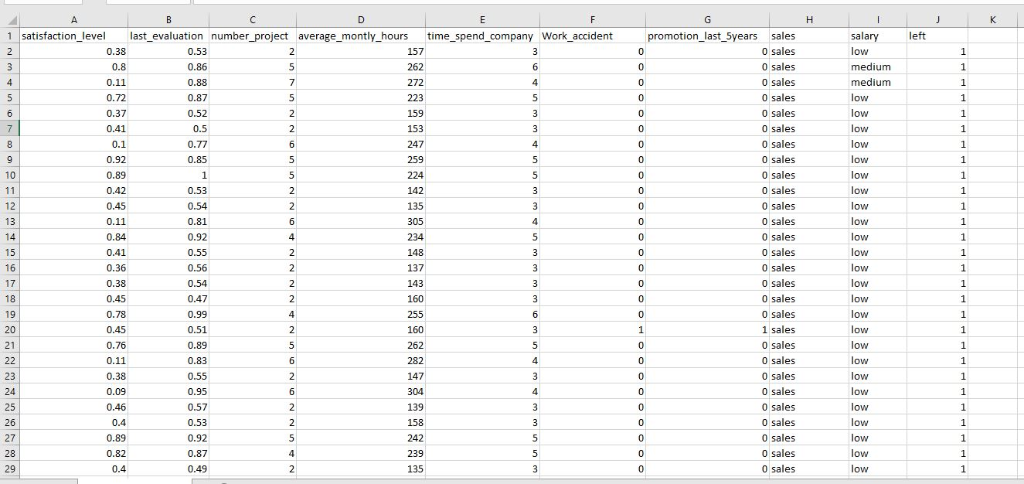
SORRY I COULDN'T ATTACH EXCEL FILE , COULD YOU PLEASE USE THE DATA IN THE PICS TO SOLVE THIS ASSIGNMENT
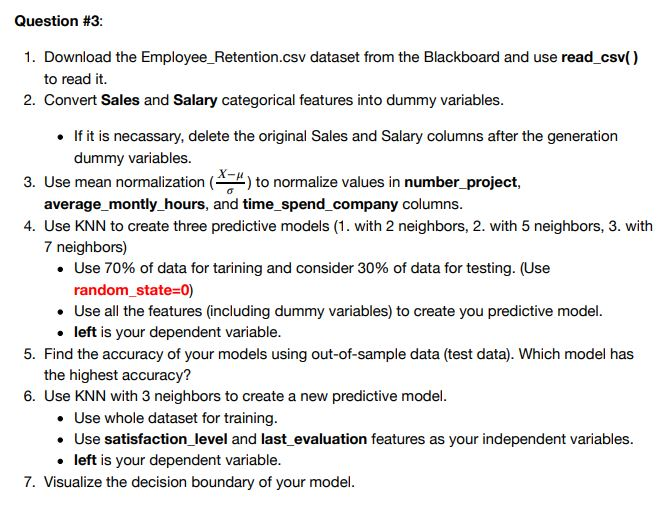
Question #3 1. Download the Employee Retention.csv dataset from the Blackboard and use read csv() to read it. 2. Convert Sales and Salary categorical features into dummy variables . If it is necassary, delete the original Sales and Salary columns after the generation dummy variables. 3. Use mean normalization ( to normalize values in number project, average_montly_hours, and time spend company columns 4. Use KNN to create three predictive models (1. with 2 neighbors, 2. with 5 neighbors, 3. with 7 neighbors) . Use 70% of data for tanning and consider 30% of data for testing. (Use random state-0) Use all the features (including dummy variables) to create you predictive model left is your dependent variable . 5. Find the accuracy of your models using out-of-sample data (test data). Which model has the highest accuracy? 6. Use KNN with 3 neighbors to create a new predictive model Use whole dataset for training Use satisfaction level and last evaluation features as your independent variables. . . left is your dependent variable 7. Visualize the decision boundary of your model Question #3 1. Download the Employee Retention.csv dataset from the Blackboard and use read csv() to read it. 2. Convert Sales and Salary categorical features into dummy variables . If it is necassary, delete the original Sales and Salary columns after the generation dummy variables. 3. Use mean normalization ( to normalize values in number project, average_montly_hours, and time spend company columns 4. Use KNN to create three predictive models (1. with 2 neighbors, 2. with 5 neighbors, 3. with 7 neighbors) . Use 70% of data for tanning and consider 30% of data for testing. (Use random state-0) Use all the features (including dummy variables) to create you predictive model left is your dependent variable . 5. Find the accuracy of your models using out-of-sample data (test data). Which model has the highest accuracy? 6. Use KNN with 3 neighbors to create a new predictive model Use whole dataset for training Use satisfaction level and last evaluation features as your independent variables. . . left is your dependent variable 7. Visualize the decision boundary of your model
Step by Step Solution
There are 3 Steps involved in it

Get step-by-step solutions from verified subject matter experts