

Question: Using quarterly data for 10 years, the regression results are given in the following table where CAR = number of new car sales per
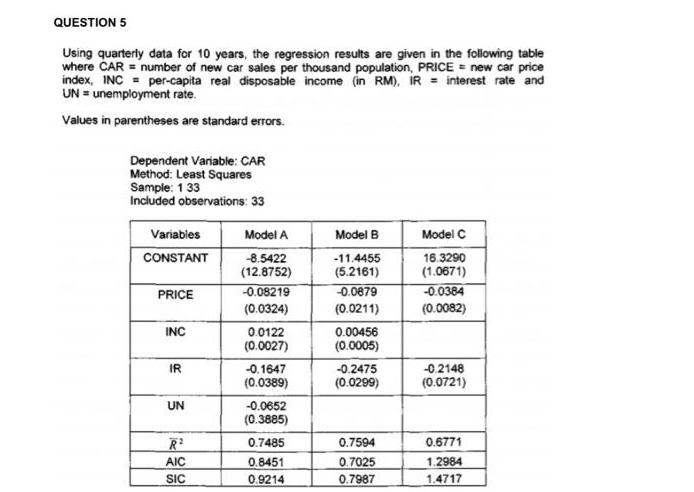
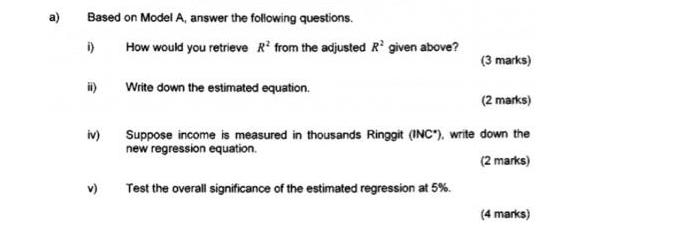
Using quarterly data for 10 years, the regression results are given in the following table where CAR = number of new car sales per thousand population, PRICE = new car price index, INC= per-capita real disposable income (in RM), IR interest rate and UN = unemployment rate. Values in parentheses are standard errors. Dependent Variable: CAR Method: Least Squares Sample: 1 33 Included observations: 33 Variables CONSTANT PRICE INC IR UN R AIC SIC Model A -8.5422 (12.8752) -0.08219 (0.0324) 0.0122 (0.0027) -0.1647 (0.0389) -0.0652 (0.3885) 0.7485 0.8451 0.9214 Model B -11.4455 (5.2161) -0.0879 (0.0211) 0.00456 (0.0005) -0.2475 (0.0299) 0.7594 0.7025 0.7987 Model C 16.3290 (1.0671) -0.0384 (0.0082) -0.2148 (0.0721) 0.6771 1.2984 1.4717 e Based on Model A, answer the following questions. i) How would you retrieve R from the adjusted R given above? Write down the estimated equation. ii) iv) (3 marks) (2 marks) Suppose income is measured in thousands Ringgit (INC"), write down the new regression equation. (2 marks) Test the overall significance of the estimated regression at 5%. (4 marks)
Step by Step Solution
3.41 Rating (167 Votes )
There are 3 Steps involved in it
The detailed ... View full answer

Get step-by-step solutions from verified subject matter experts