

Question: Using r code provided, answer the following questions A hospital surgical unit was interested in predicting survival time in patients undergoing a particular type of
Using r code provided, answer the following questions
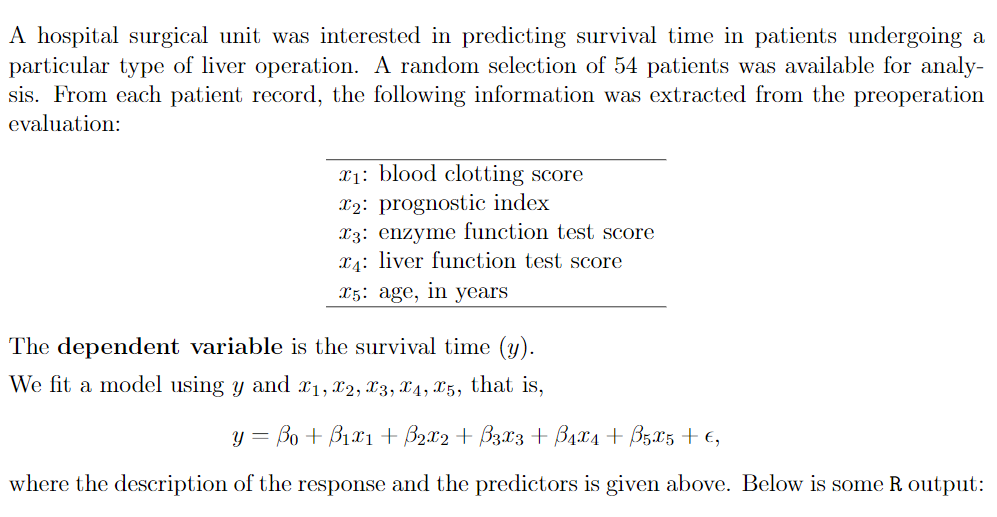
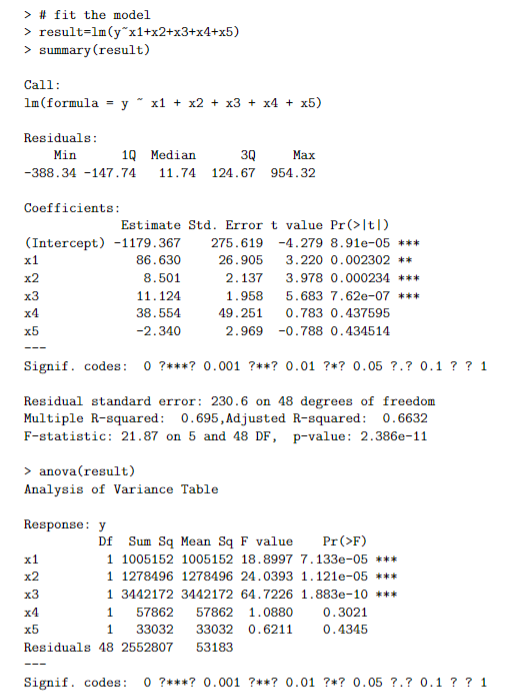
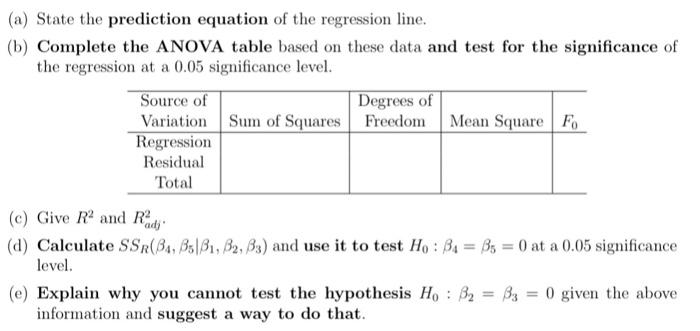
A hospital surgical unit was interested in predicting survival time in patients undergoing a particular type of liver operation. A random selection of 54 patients was available for analy- sis. From each patient record, the following information was extracted from the preoperation evaluation: T1: blood clotting score T2: prognostic index r3: enzyme function test score : liver function test score rs: age, in years The dependent variable is the survival ti We fit a model using y and r1, r2, r3, rA, r5, that is, where the description of the response and the predictors is given above. Below is some R output > # fit the model > result lm(y x1+x2+x3+x4+x5) summary (result) Call lm (formula - y x1 + x2 + x3 + x4 x5) Residuals -388.34-147.74 11.74 124.67 954.32 Coefficients Min 1Q Median 3Q Max Estimate Std. Error t value Pr>ltI) (Intercept) 1179.367 275.619 -4.279 8.91e-05 86.630 8.501 11.124 38.554 -2.340 26.905 3.220 0.002302 * 2.137 3.978 0.000234 1.958 5.683 7.62e-07 49.251 0.783 0.437595 2.969 -0.788 0.434514 Signif. codes: 0 ? ? 0.001 ?**? 0.01 ?*? 0.05 ?,? 0.1 ? ? 1 Residual standard error: 230.6 on 48 degrees of freedom Multiple R-squared 0.695,Adjusted R-squared 0.6632 F-statistic: 21.87on 5 and 48 DF , p-value: 2.386e-11 > anova (result) Analysis of Variance Table Response: y Df Sum Sq Mean Sq F value Pr>F) 1 1005152 1005152 18.8997 7.133e-05 1 1278496 1278496 24.0393 1.121e-05 1 3442172 3442172 64.7226 1.883e-10 1 57862 57862 1.0880 0.3021 1 33032 33032 0.6211 0 0.4345 Residuals 48 2552807 53183 Signif. codes: 0? 0.001?*? 0.01* 0.05 ?.? 0.1??1 (a) State the prediction equation of the regression line. (b) Complete the ANOVA table based on these data and test for the significance of the regression at a 0.05 significance level. Source of Degrees of Variation Sum of Squares Freedom Mean Square Fo Regression Residual Total (c) Give R2 and Rd (d) Calculate SSR(A, 5, 2, As) and use it to test Ho : ,-As = 0 at a 0.05 significance (e) Explain why you cannot test the hypothesis Ho :B2 -B3 0 given the above information and suggest a way to do that A hospital surgical unit was interested in predicting survival time in patients undergoing a particular type of liver operation. A random selection of 54 patients was available for analy- sis. From each patient record, the following information was extracted from the preoperation evaluation: T1: blood clotting score T2: prognostic index r3: enzyme function test score : liver function test score rs: age, in years The dependent variable is the survival ti We fit a model using y and r1, r2, r3, rA, r5, that is, where the description of the response and the predictors is given above. Below is some R output > # fit the model > result lm(y x1+x2+x3+x4+x5) summary (result) Call lm (formula - y x1 + x2 + x3 + x4 x5) Residuals -388.34-147.74 11.74 124.67 954.32 Coefficients Min 1Q Median 3Q Max Estimate Std. Error t value Pr>ltI) (Intercept) 1179.367 275.619 -4.279 8.91e-05 86.630 8.501 11.124 38.554 -2.340 26.905 3.220 0.002302 * 2.137 3.978 0.000234 1.958 5.683 7.62e-07 49.251 0.783 0.437595 2.969 -0.788 0.434514 Signif. codes: 0 ? ? 0.001 ?**? 0.01 ?*? 0.05 ?,? 0.1 ? ? 1 Residual standard error: 230.6 on 48 degrees of freedom Multiple R-squared 0.695,Adjusted R-squared 0.6632 F-statistic: 21.87on 5 and 48 DF , p-value: 2.386e-11 > anova (result) Analysis of Variance Table Response: y Df Sum Sq Mean Sq F value Pr>F) 1 1005152 1005152 18.8997 7.133e-05 1 1278496 1278496 24.0393 1.121e-05 1 3442172 3442172 64.7226 1.883e-10 1 57862 57862 1.0880 0.3021 1 33032 33032 0.6211 0 0.4345 Residuals 48 2552807 53183 Signif. codes: 0? 0.001?*? 0.01* 0.05 ?.? 0.1??1 (a) State the prediction equation of the regression line. (b) Complete the ANOVA table based on these data and test for the significance of the regression at a 0.05 significance level. Source of Degrees of Variation Sum of Squares Freedom Mean Square Fo Regression Residual Total (c) Give R2 and Rd (d) Calculate SSR(A, 5, 2, As) and use it to test Ho : ,-As = 0 at a 0.05 significance (e) Explain why you cannot test the hypothesis Ho :B2 -B3 0 given the above information and suggest a way to do that
Step by Step Solution
There are 3 Steps involved in it

Get step-by-step solutions from verified subject matter experts