

Question: USING R Instructions In this exercise, we will work with the 'mpg' data. To access this data set you need to import the tidyverse library
USING R
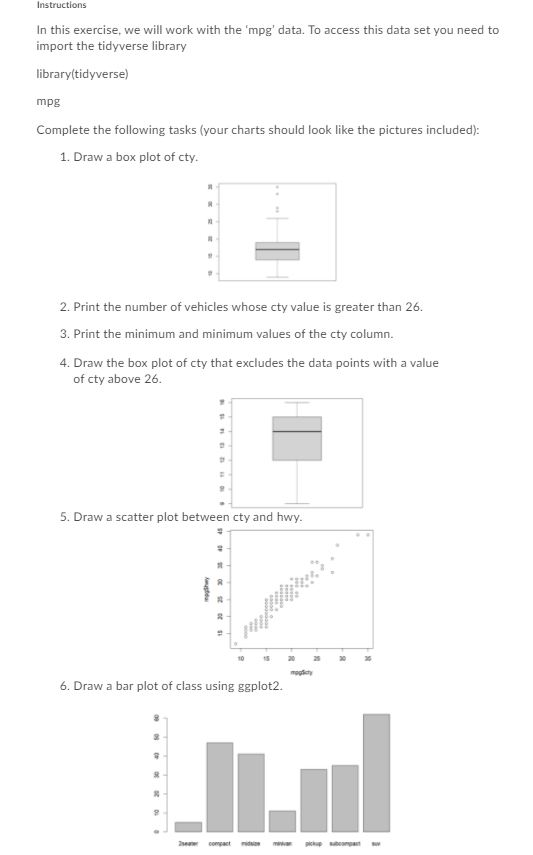
Instructions In this exercise, we will work with the 'mpg' data. To access this data set you need to import the tidyverse library library(tidyverse) mpg Complete the following tasks (your charts should look like the pictures included): 1. Draw a box plot of cty. 2. Print the number of vehicles whose cty value is greater than 26. 3. Print the minimum and minimum values of the cty column. 4. Draw the box plot of cty that excludes the data points with a value of cty above 26. 5. Draw a scatter plot between cty and hwy. 6. Draw a bar plot of class using ggplot2
Step by Step Solution
There are 3 Steps involved in it
1 Expert Approved Answer
Step: 1 Unlock

Question Has Been Solved by an Expert!
Get step-by-step solutions from verified subject matter experts
Step: 2 Unlock
Step: 3 Unlock