

Question: Using R , please answer ( a ) until ( e ) . ( a ) ( 1 points ) Create a scatterplot where y
Using R please answer a until e
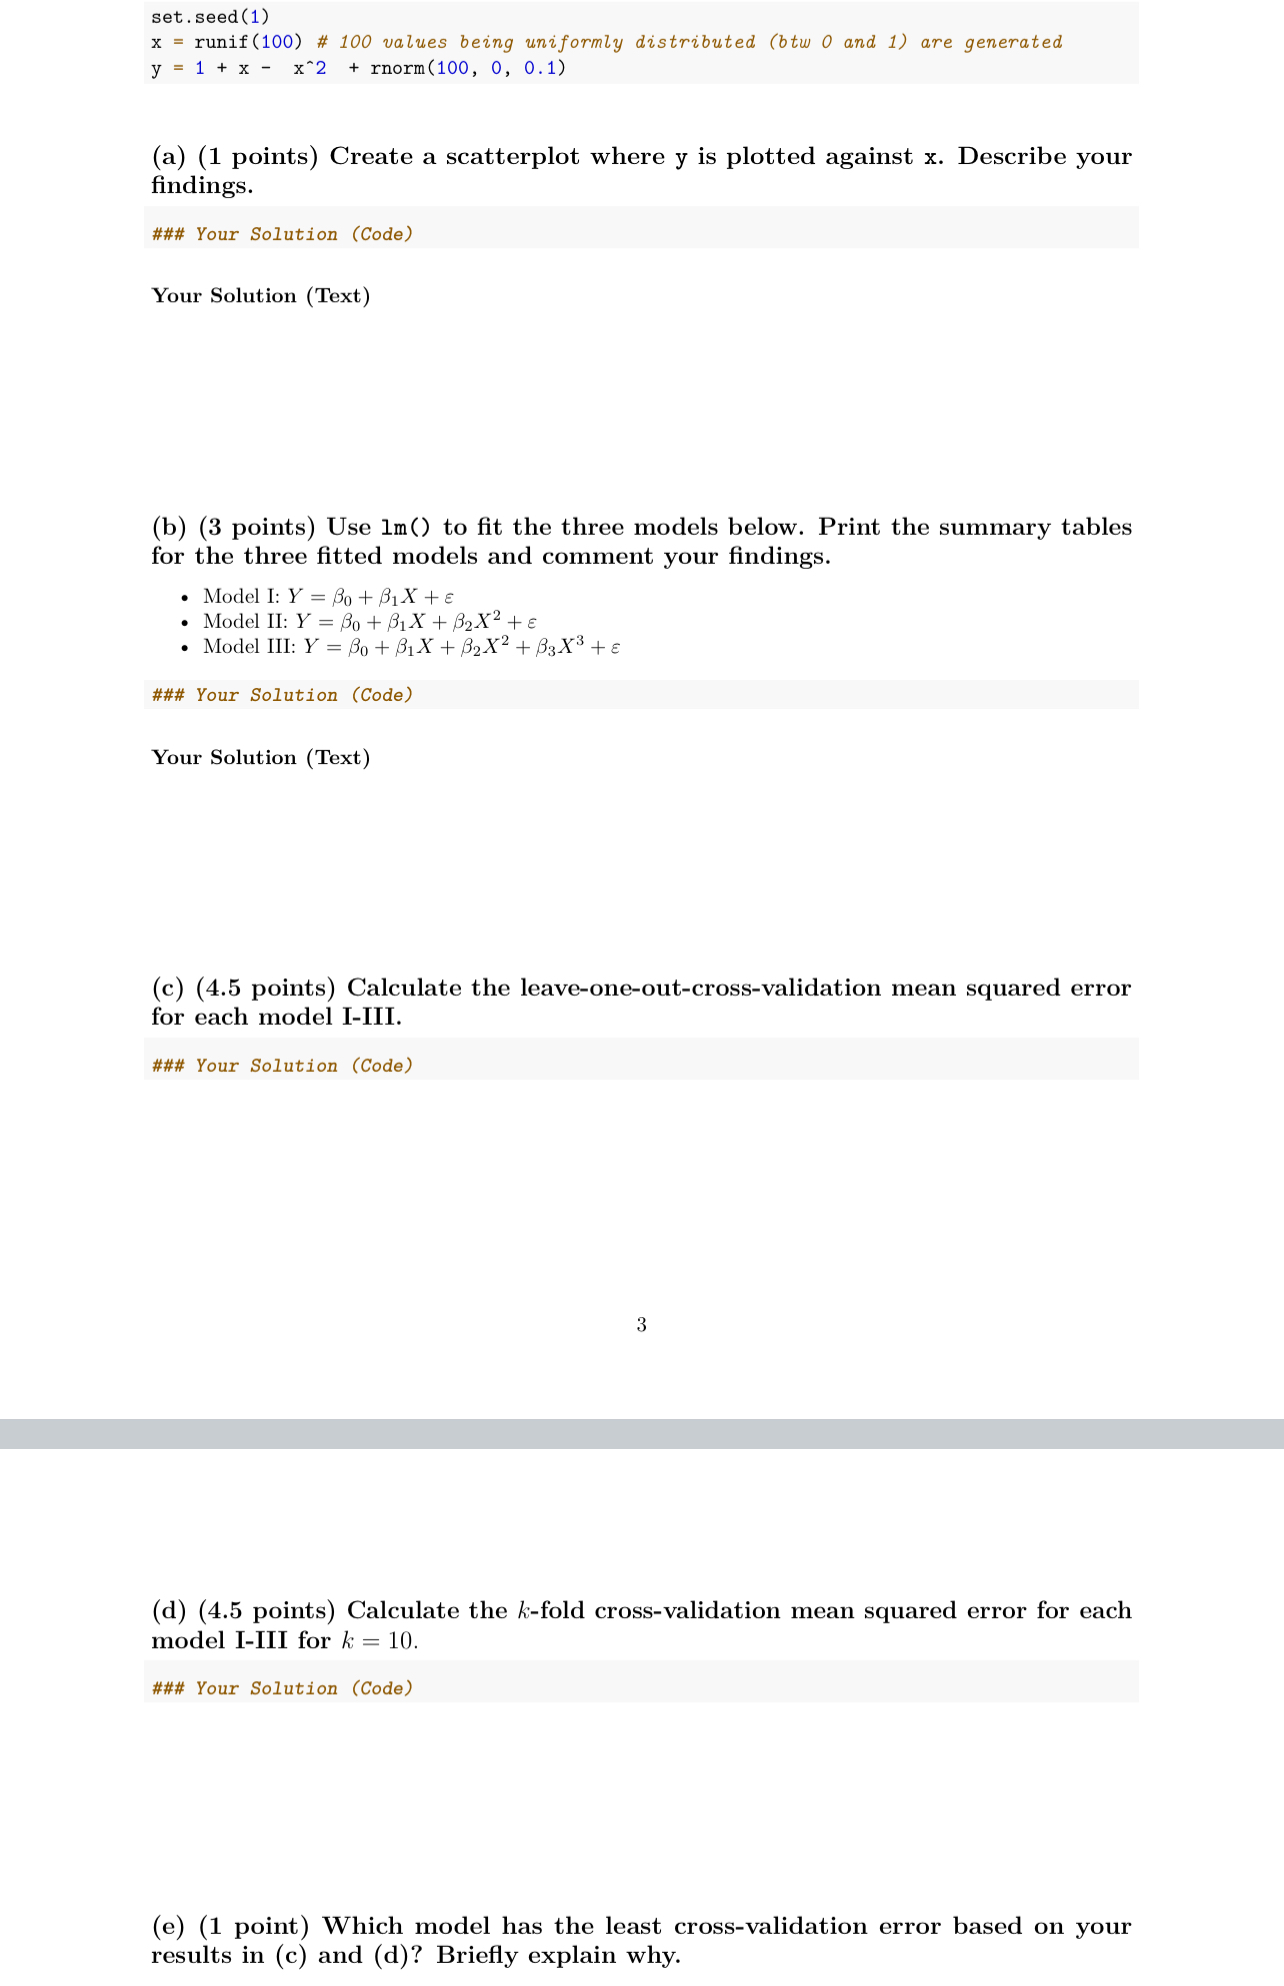
a points Create a scatterplot where y is plotted against x Describe your findings.### Your Solution Code
Your Solution Text
b points Use to fit the three models below. Print the summary tables for the three fitted models and comment your findings.
Model I:
Model II:
Model III:
### Your Solution Code
Your Solution Text
c points Calculate the leaveoneoutcrossvalidation mean squared error for each model IIII.
### Your Solution Code
d points Calculate the fold crossvalidation mean squared error for each model IIII for
### Your Solution Code
e point Which model has the least crossvalidation error based on your results in c and d Briefly explain why.
Step by Step Solution
There are 3 Steps involved in it
1 Expert Approved Answer
Step: 1 Unlock

Question Has Been Solved by an Expert!
Get step-by-step solutions from verified subject matter experts
Step: 2 Unlock
Step: 3 Unlock