

Question: Using R programming please answer . Upload the screenshots of executed code and its results (including graphics) Data file: Crosstab2 The following observations
Using R programming please answer . Upload the screenshots of " executed code and its results (including graphics) "
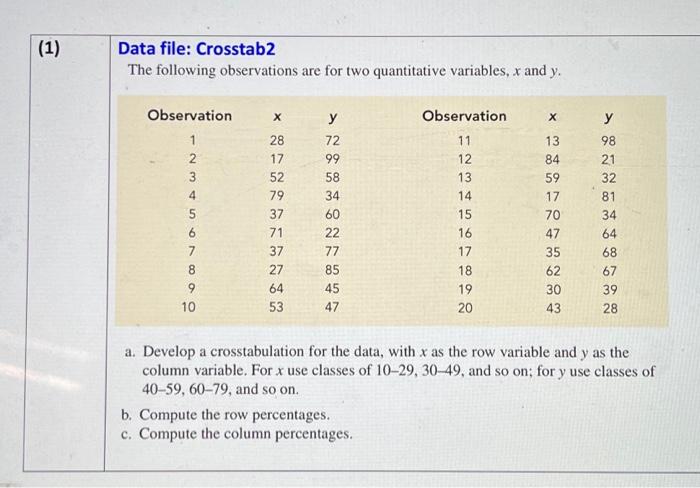
Data file: Crosstab2 The following observations are for two quantitative variables, x and y. a. Develop a crosstabulation for the data, with x as the row variable and y as the column variable. For x use classes of 1029,3049, and so on; for y use classes of 4059,6079, and so on. b. Compute the row percentages. c. Compute the column percentages
Step by Step Solution
There are 3 Steps involved in it
1 Expert Approved Answer
Step: 1 Unlock

Question Has Been Solved by an Expert!
Get step-by-step solutions from verified subject matter experts
Step: 2 Unlock
Step: 3 Unlock