

Question: Using R programning, how do I change x-axis labels to descriptive one, specifically to the the ones highlighted, see picture. Frequency Jobs OC 27 5
Using R programning, how do I change x-axis labels to descriptive one, specifically to the the ones highlighted, see picture.
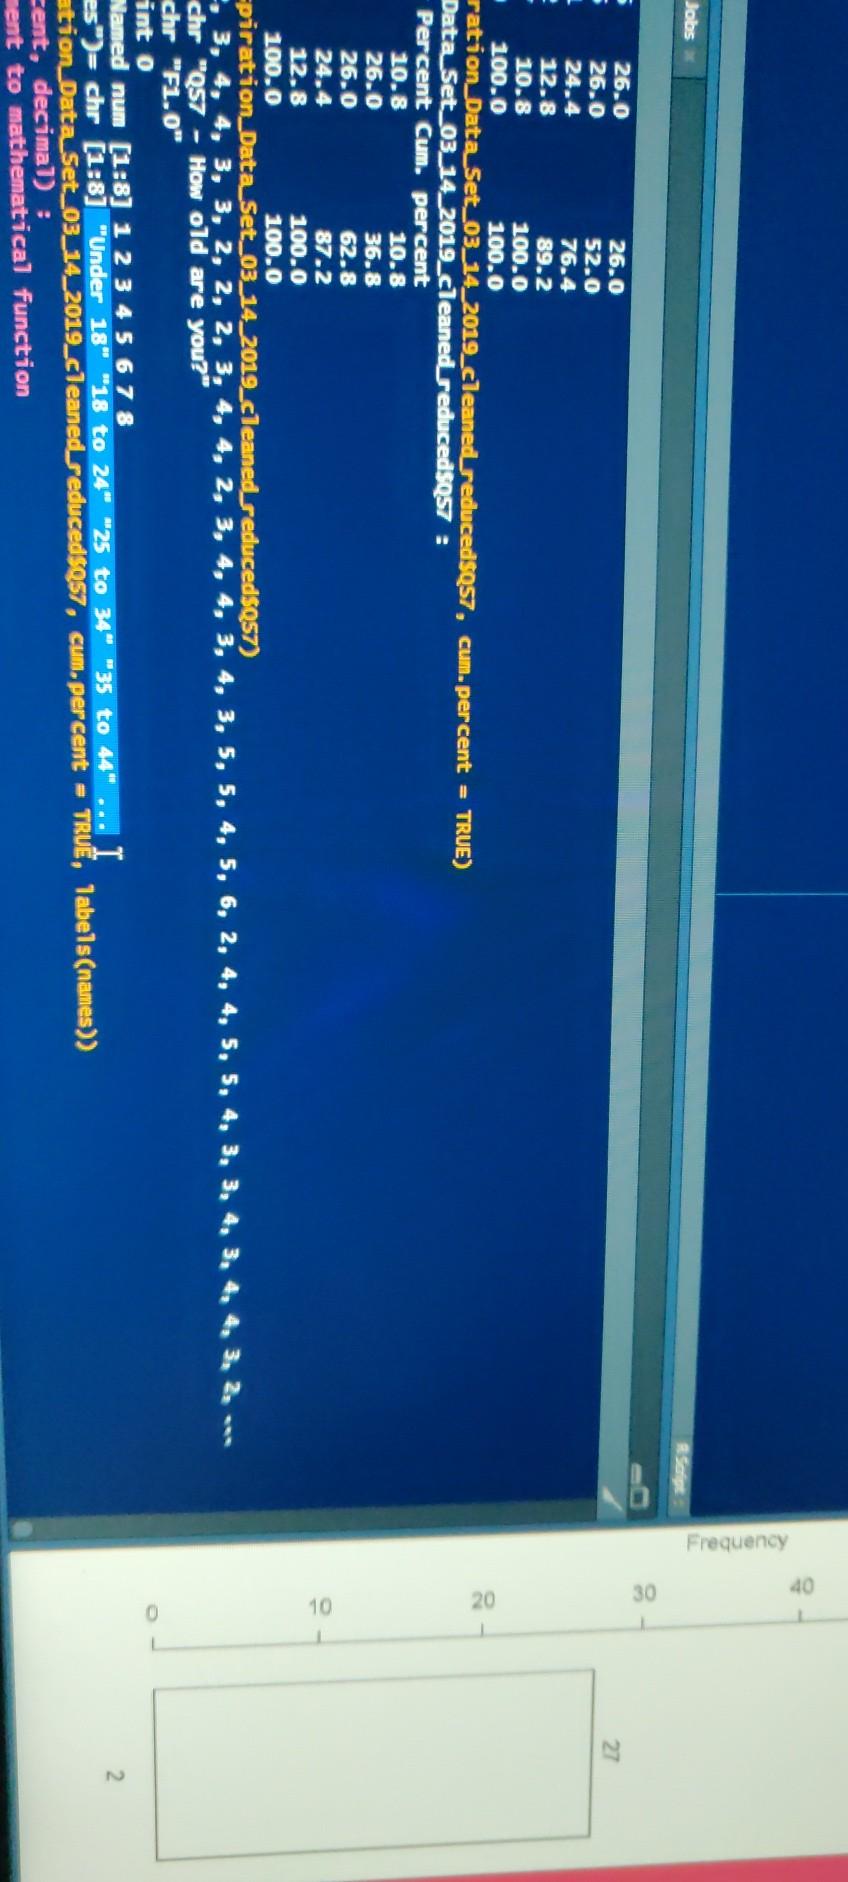
Frequency Jobs OC 27 5 20 26.0 26.0 26.0 52.0 24.4 76.4 12.8 89.2 10.8 100.0 100.0 100.0 ration_Data_set_03_14_2019_cleaned reducedSQS7, cum. percent = TRUE) Data Set_03_14_2019_cleaned reduced$QS7 : Percent Cum. percent 10.8 10.8 26.0 36.8 26.0 62.8 24.4 87.2 12.8 100.0 100.0 100.0 piration_Data_set_03_14_2019_cleaned seducedSQ57) , 3, 4, 4, 3, 3, 2, 2, 2, 3, 4, 4, 2, 3, 4, 4, 3, 4, 3, 5, 5, 4, 5, 6, 2, 4, 4, 5, 5, 4, 3, 3, 4, 3, 4, chr "QS7 - How old are you?" chr F1.0" into Named num (1:8] 1 2 3 4 5 6 7 8 es")= chr [1:8] "Under 18" "18 to 24" "25 to 34" 35 to 44" ... I ation Data Set_03_14_2019_cleaned reduced $257, cum. percent = TRUE, Tabels(names)) cent, decimal) : ment to mathematical function 10 O 2
Step by Step Solution
There are 3 Steps involved in it

Get step-by-step solutions from verified subject matter experts