

Question: Using R studio, data is something like this , how to plot histogram with 15 min bar width Date column: -2001-01-01 06:57:04 UTC 2001-01-01 08:54:31
Using R studio, data is something like this , how to plot histogram with 15 min bar width
Date column: -"2001-01-01 06:57:04 UTC" "2001-01-01 08:54:31 UTC" "2001-01-02 07:30:03 UTC" "2001-01-02 23:17:41 UTC" Magnitude column : 7.5 6.8 6.4 6.0 7.1 7.0 6.0 7.7 6.4 6.0 6.9 6.0 6.3 6.0 7.7 6.2 6.0 6.6 7.4 6.1 6.2 6.1 6.2 6.0 7.1 6.2
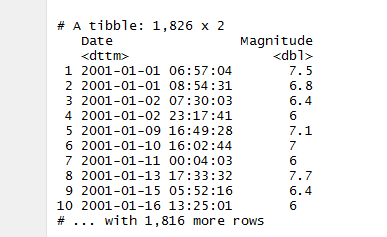

# A tibble: 1,826 x 2 Date Magnitude
Step by Step Solution
There are 3 Steps involved in it

Get step-by-step solutions from verified subject matter experts