

Question: Using R Studio, how do you create box plots stratified by zip codes 1. Using only businesses in with zip code = to 60634 and
Using R Studio, how do you create box plots stratified by zip codes 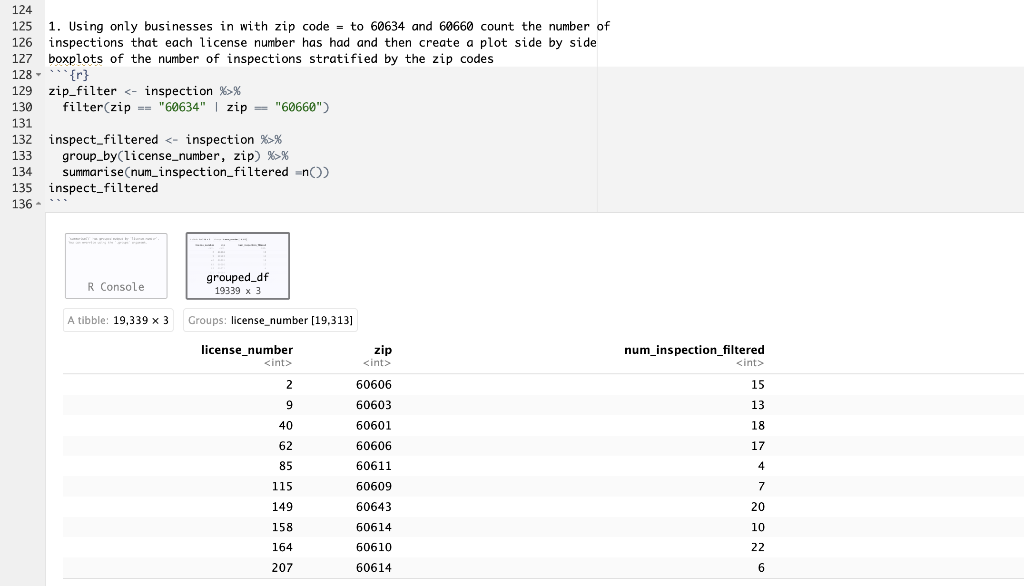
1. Using only businesses in with zip code = to 60634 and 60660 count the number of inspections that each license number has had and then create a plot side by side boxplots of the number of inspections stratified by the zip codes
Step by Step Solution
There are 3 Steps involved in it
1 Expert Approved Answer
Step: 1 Unlock

Question Has Been Solved by an Expert!
Get step-by-step solutions from verified subject matter experts
Step: 2 Unlock
Step: 3 Unlock