

Question: Using R to answer these question. Tkan you Starting from the commands below, make the following changes to the plot: (Please ignore all warning messages)
Using R to answer these question. Tkan you
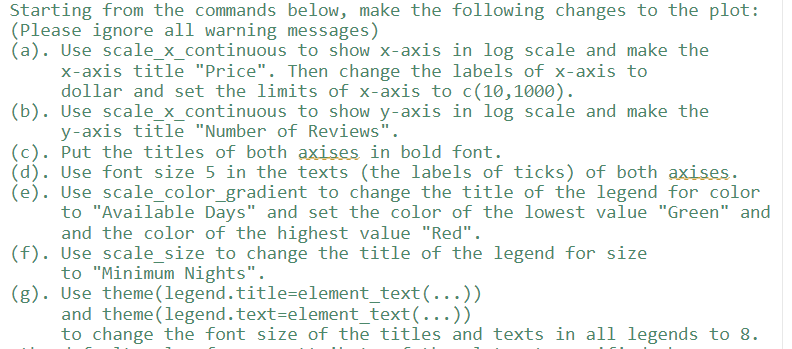
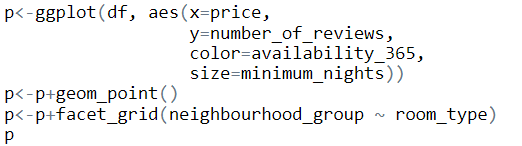
Starting from the commands below, make the following changes to the plot: (Please ignore all warning messages) (a). Use scale_x_continuous to show x-axis in log scale and make the x-axis title "Price". Then change the labels of x-axis to dollar and set the limits of x-axis to c(10,1000). (b). Use scale_x_continuous to show y-axis in log scale and make the y-axis title "Number of Reviews". (c). Put the titles of both axises in bold font. (d). Use font size 5 in the texts (the labels of ticks) of both axises. (e). Use scale_color_gradient to change the title of the legend for color to "Availabble Days" and set the color of the lowest value "Green" and and the color of the highest value "Red". (f). Use scale_size to change the title of the legend for size to "Minimum Nights". (g). Use theme(legend.title=element_text () ) and theme(legend.text=element_-ext () ) to change the font size of the titles and texts in all legends to 8
Step by Step Solution
There are 3 Steps involved in it

Get step-by-step solutions from verified subject matter experts