

Question: Using Rapidminer: Normalize the data and then apply an iterative kmeans clustering in RapidMiner using the XMeans operator, specifying parameters: k_min = 2, k_max =
Using Rapidminer:
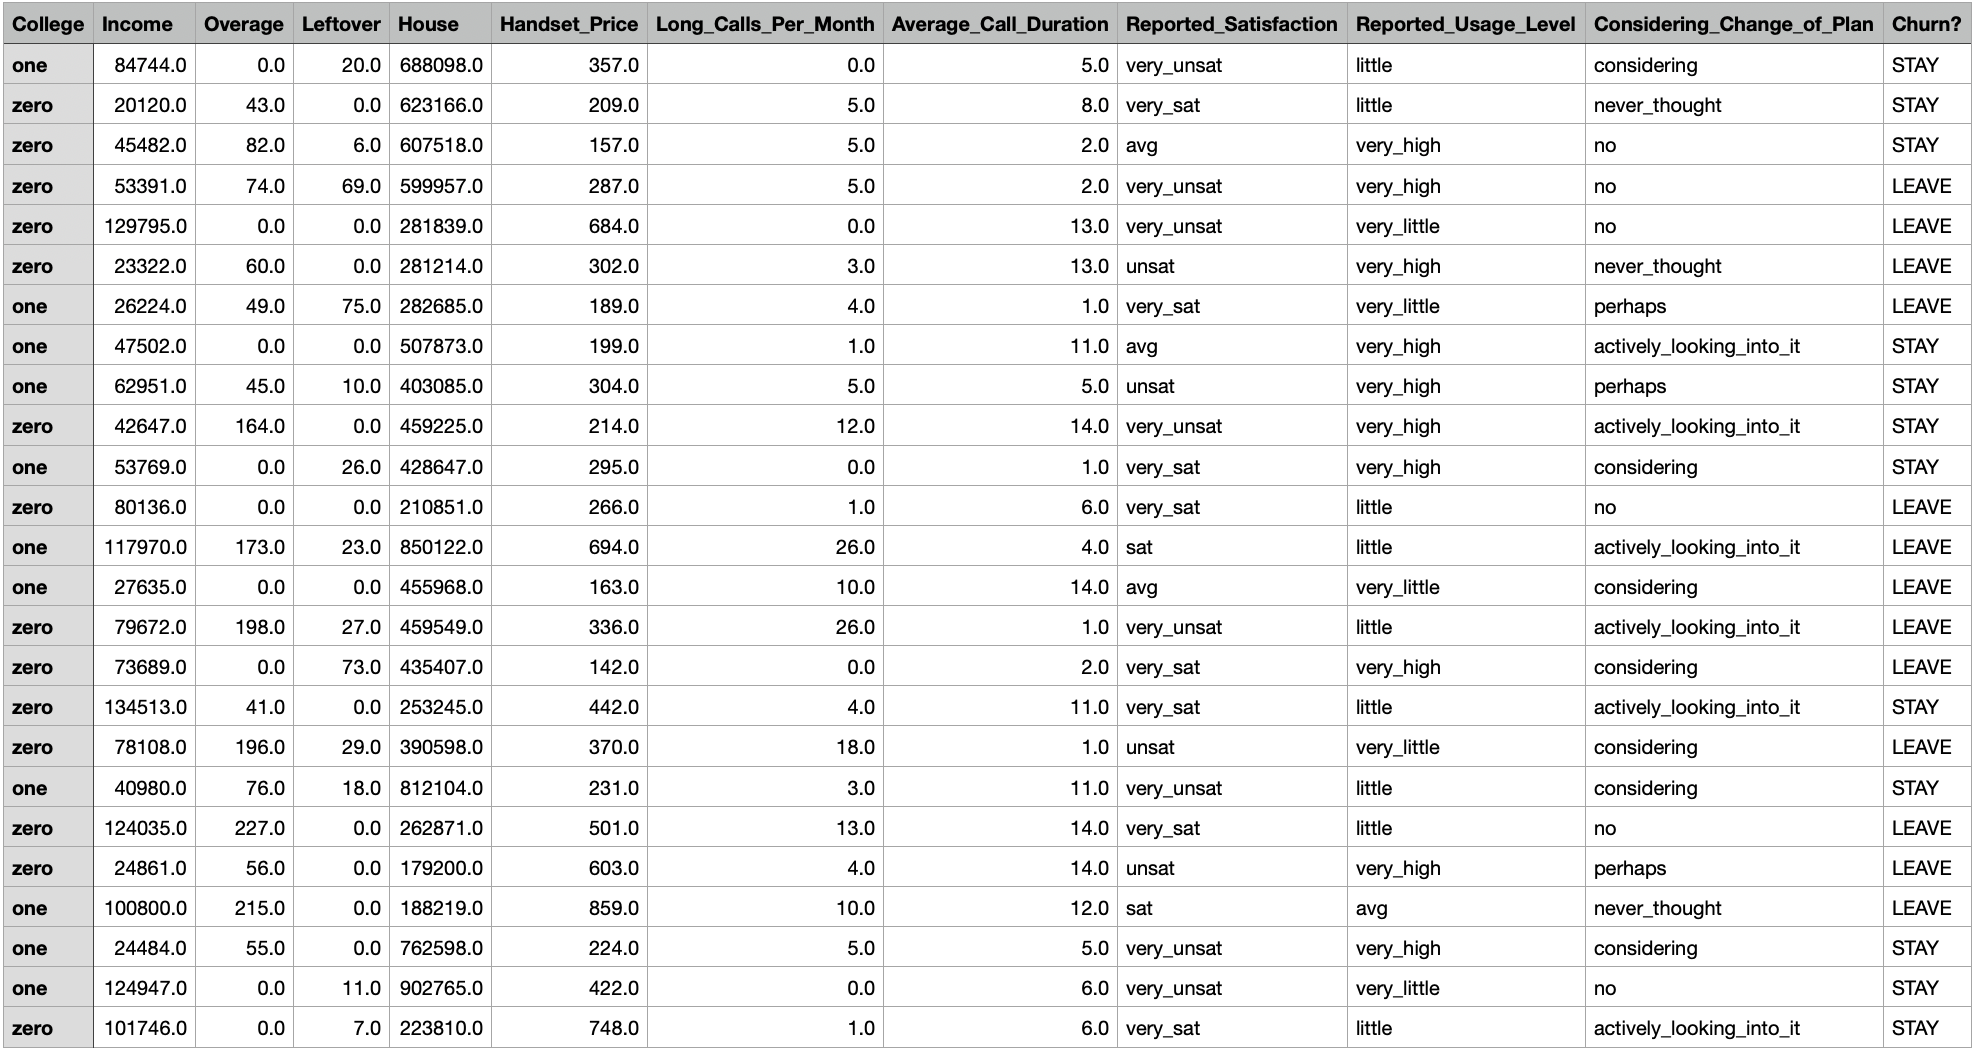
- Normalize the data and then apply an iterative kmeans clustering in RapidMiner using the XMeans operator, specifying parameters: k_min = 2, k_max = 10. How many clusters appear?
- What would happen if the data were not normalized?
- Compare the cluster centroid to characterize the different clusters, and try to give each cluster a label.
- To check the stability of the clusters, remove a random 5% of the data (by taking a random sample of 95% of the records), and repeat the analysis. Does the same picture emerge?
- Which cluster(s) would you target for marketing offers, and what types of offers would you target to customers in those cluster(s)?
- Which cluster has a higher proportion of Churn? = LEAVE customers? Show a bar chart or a table comparing each clusters proportion of LEAVE vs. STAY. (Hint: You can analyze the Clustered Set obtained from X-Means operator to create a pivot table using Turbo Prep.)
Step by Step Solution
There are 3 Steps involved in it
1 Expert Approved Answer
Step: 1 Unlock

Question Has Been Solved by an Expert!
Get step-by-step solutions from verified subject matter experts
Step: 2 Unlock
Step: 3 Unlock