

Question: Using rectangles each of whose height is given by the value of the function at the midpoint of the rectangle's base (the midpoint rule), estimate
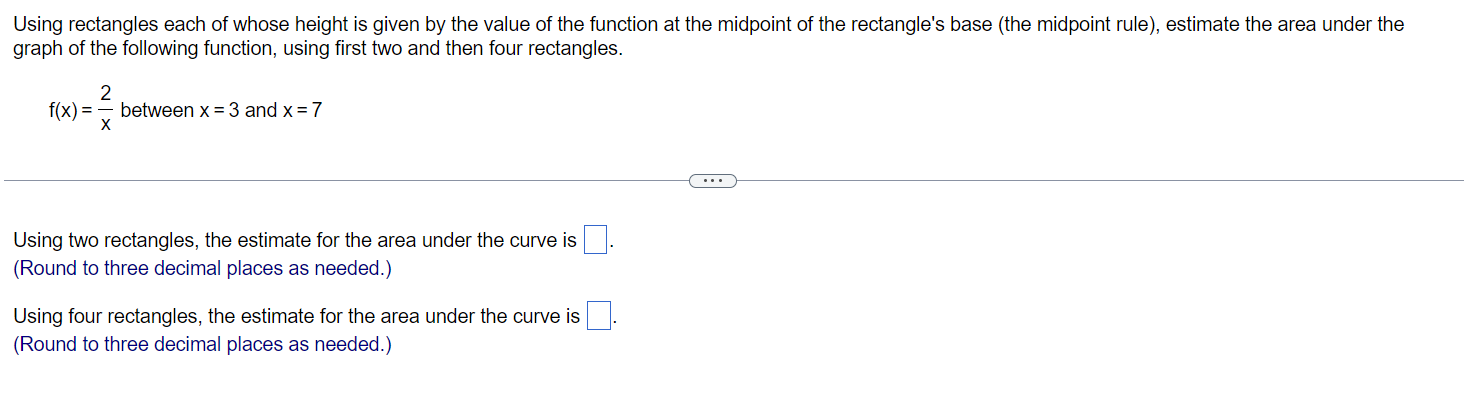


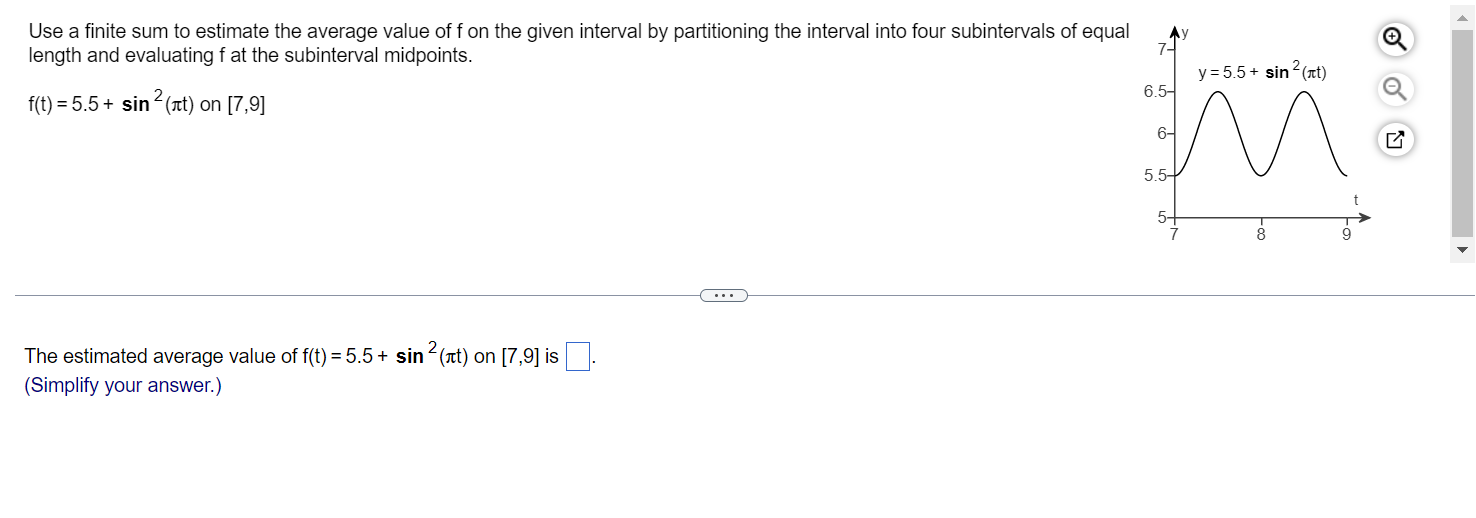
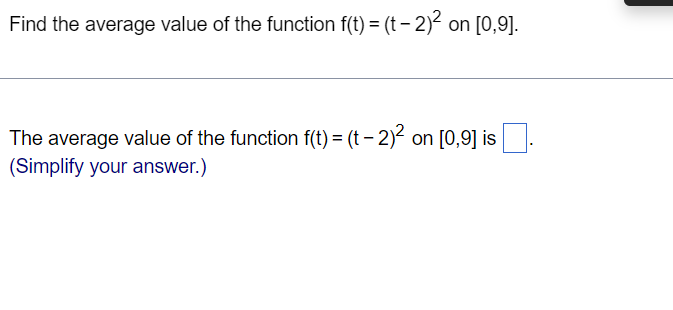
Using rectangles each of whose height is given by the value of the function at the midpoint of the rectangle's base (the midpoint rule), estimate the area under the graph of the following function, using first two and then four rectangles. 2 f(x) = 7 between x = 3 and x = 7 x Using two rectangles, the estimate for the area under the curve is (Round to three decimal places as needed.) Using four rectangles, the estimate for the area under the curve is (Round to three decimal places as needed.) length and evaluating f at the subinterval midpoints. y : 55 + sin and) Use a finite sum to estimate the average value of f on the given interval by partitioning the interval into four subintervals of equal y Q q f(t) = 5.5 + sin 2m) on [7,9] The estimated average value of f(t) = 5.5 + sin 2(art) on [7,9] is (Simplify your answer.) Find the average value of the function f(t) = (t 2)2 on [0,9]. The average value of the function f(t) = (t - 2)2 on [0,9] is (Simplify your answer.)
Step by Step Solution
There are 3 Steps involved in it

Get step-by-step solutions from verified subject matter experts