

Question: Using Rstudio 1. Use the following graphics functions: autoplot(), ggseasonplot(), ggsubseriesplot(), gglagplot(), ggAcf() and explore features from the following time series: hsales, usdeaths, bricksq, sunspotarea,
Using Rstudio
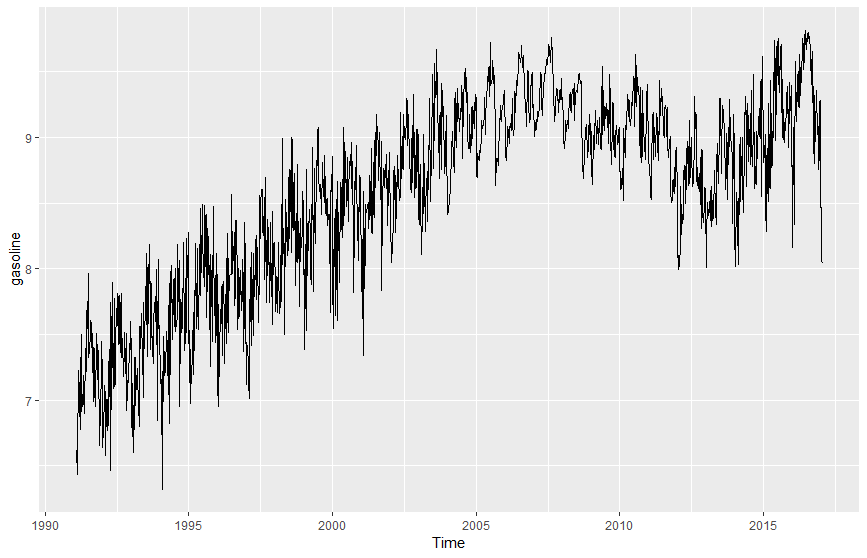
1. Use the following graphics functions: autoplot(), ggseasonplot(), ggsubseriesplot(), gglagplot(), ggAcf() and explore features from the following time series: hsales, usdeaths, bricksq, sunspotarea, gasoline.
- Can you spot any seasonality, cyclicity and trend?
- What do you learn about the series?
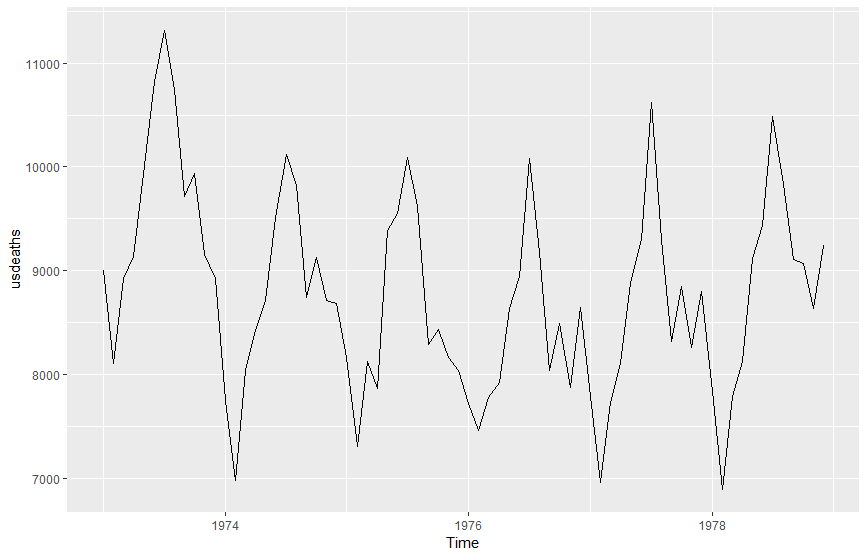
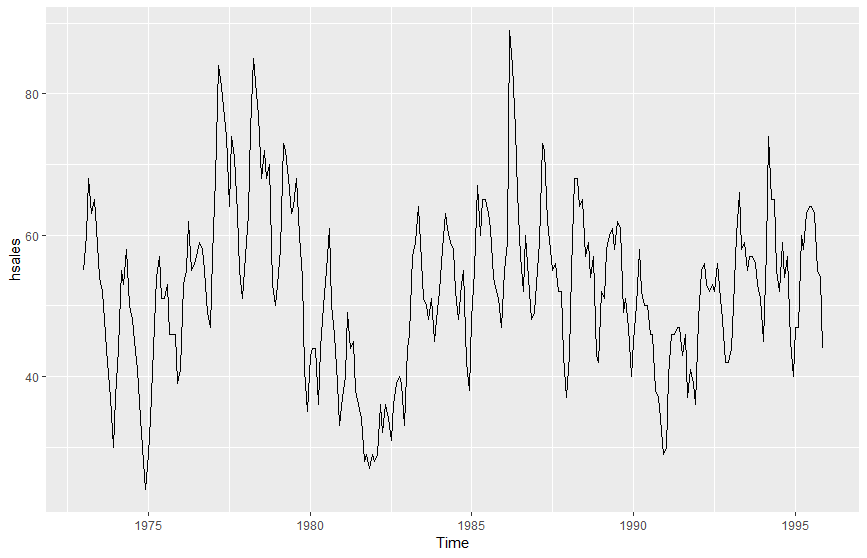
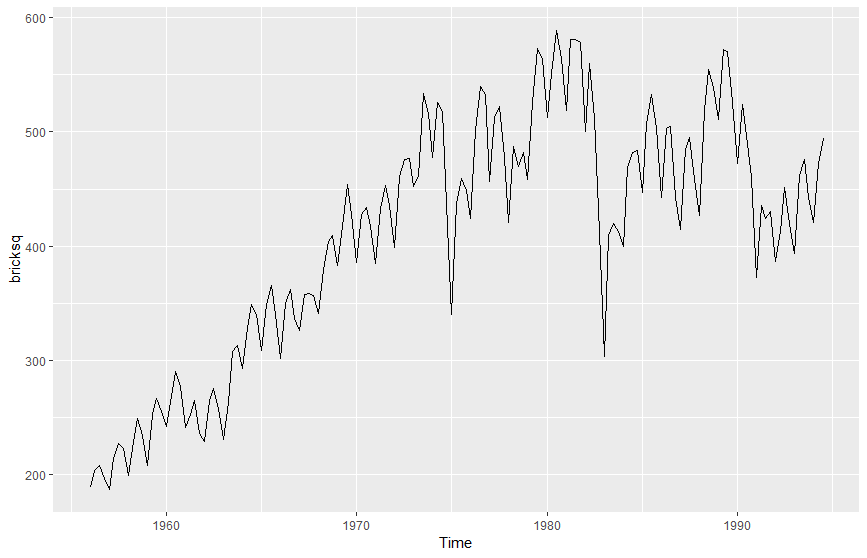
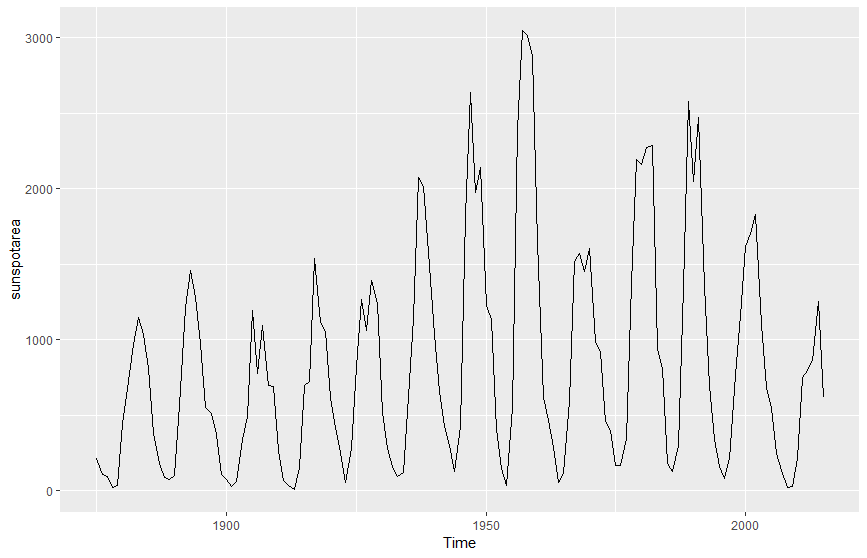
11000- 10000- 8000 7000 1976 Time 1974 1978 80- 60 40- 1975 1980 1985 1990 1995 600 500 D 400 300 200- 1980 1990 1960 1970 Time 3000 2000 - 1000 1900 1950 2000 Time 9 8 1990 1995 2010 2015 Time 11000- 10000- 8000 7000 1976 Time 1974 1978 80- 60 40- 1975 1980 1985 1990 1995 600 500 D 400 300 200- 1980 1990 1960 1970 Time 3000 2000 - 1000 1900 1950 2000 Time 9 8 1990 1995 2010 2015 Time
Step by Step Solution
There are 3 Steps involved in it
1 Expert Approved Answer
Step: 1 Unlock

Question Has Been Solved by an Expert!
Get step-by-step solutions from verified subject matter experts
Step: 2 Unlock
Step: 3 Unlock