

Question: using SAS/R-studio/mintab/matlab pictured below is the inout values given on an excel spreadsheet. M N 36.5 A B D E F G 1 Name H
using SAS/R-studio/mintab/matlab 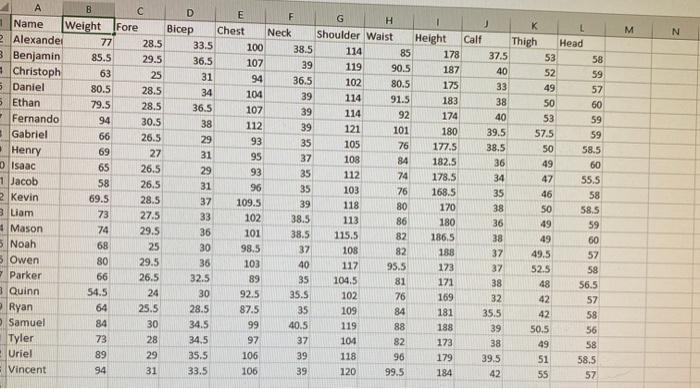
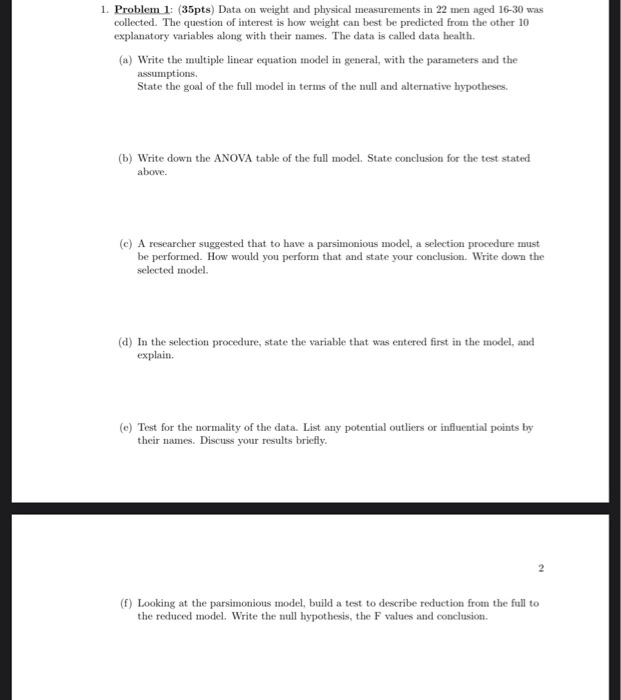
M N 36.5 A B D E F G 1 Name H Weight Fore Bicep Chest Neck Shoulder Waist 2 Alexander 77 Height 28.5 Calf Thigh Head 33.5 100 38.5 114 3 Benjamin 85 85.5 29.5 178 37.5 53 58 107 39 119 90.5 Christoph 63 187 40 25 52 59 31 94 36.5 102 80.5 5 Daniel 175 33 80.5 28.5 49 57 34 104 39 114 91.5 5 Ethan 183 38 79.5 28.5 50 60 36.5 107 39 114 Fernando 92 174 40 94 53 30.5 59 38 112 39 121 101 Gabriel 180 39.5 66 26.5 57.5 59 29 93 35 105 76 177.5 38.5 50 Henry 69 27 58.5 31 95 37 108 84 182,5 36 49 Isaac 65 60 26.5 29 93 35 112 74 178.5 1 Jacob 34 47 58 55.5 26.5 31 96 35 103 76 168.5 35 2 Kevin 46 58 69.5 28.5 37 109.5 39 118 80 170 38 50 3 Liam 58.5 73 27.5 33 102 38.5 113 86 180 36 49 Mason 59 74 29.5 36 101 38.5 115.5 82 186.5 38 49 60 5 Noah 68 25 30 98.5 37 108 82 188 37 49.5 57 5 Owen 80 29.5 36 103 40 117 95.5 173 37 52.5 58 Parker 66 26.5 32.5 89 35 104.5 81 171 38 48 56.5 Quinn 54.5 24 30 92.5 102 76 169 32 42 57 Ryan 64 25.5 28.5 87.5 35 109 84 181 35.5 42 58 Samuel 84 30 34.5 99 40.5 119 88 188 39 50.5 56 Tyler 73 28 34.5 97 37 104 82 173 38 49 58 Uriel 89 29 35.5 106 39 118 96 179 51 58.5 Vincent 94 31 33.5 106 39 120 99.5 184 42 55 57 35.5 39.5 1. Problem 1: (35pts) Data on weight and physical measurements in 22 men aged 16-30 was collected. The question of interest is how weight can best be predicted from the other 10 explanatory variables along with their names. The data is called data health. (a) Write the multiple linear equation model in general, with the parameters and the assumptions. State the goal of the full model in terms of the mill and alternative hypotheses (b) Write down the ANOVA table of the full model, State conclusion for the test stated above. (c) A researcher suggested that to have a parsimonious model, a selection procedure must be performed. How would you perform that and state your conclusion. Write down the selected model (a) In the selection procedure, state the variable that was entered first in the model, and explain. (e) Test for the normality of the data. List any potential outliers or influential points by their names. Discuss your results briefly. (1) Looking at the parsimonious model, build a test to describe reduction from the full to the reduced model. Write the null hypothesis, the F values and conclusion pictured below is the inout values given on an excel spreadsheet.
Step by Step Solution
There are 3 Steps involved in it
1 Expert Approved Answer
Step: 1 Unlock

Question Has Been Solved by an Expert!
Get step-by-step solutions from verified subject matter experts
Step: 2 Unlock
Step: 3 Unlock