

Question: Using Small graphs ( appropriately labeled ) show each of the following ( draw a graph for each ) and draw the appropriate curves before
Using Small graphs appropriately labeled show each of the following draw a graph for each and draw the appropriate curves before and after
What happens to demand for ice cream after a report comes out saying ice cream is unhealthy
Demand for ice cream when the income of a population increases
Demand for ice cream when the size of a population decreases
Supply of ice cream when a report comes out praising the health benefits of italian ice this is a substitute for ice cream
Supply of ice cream when the cost of cream increases
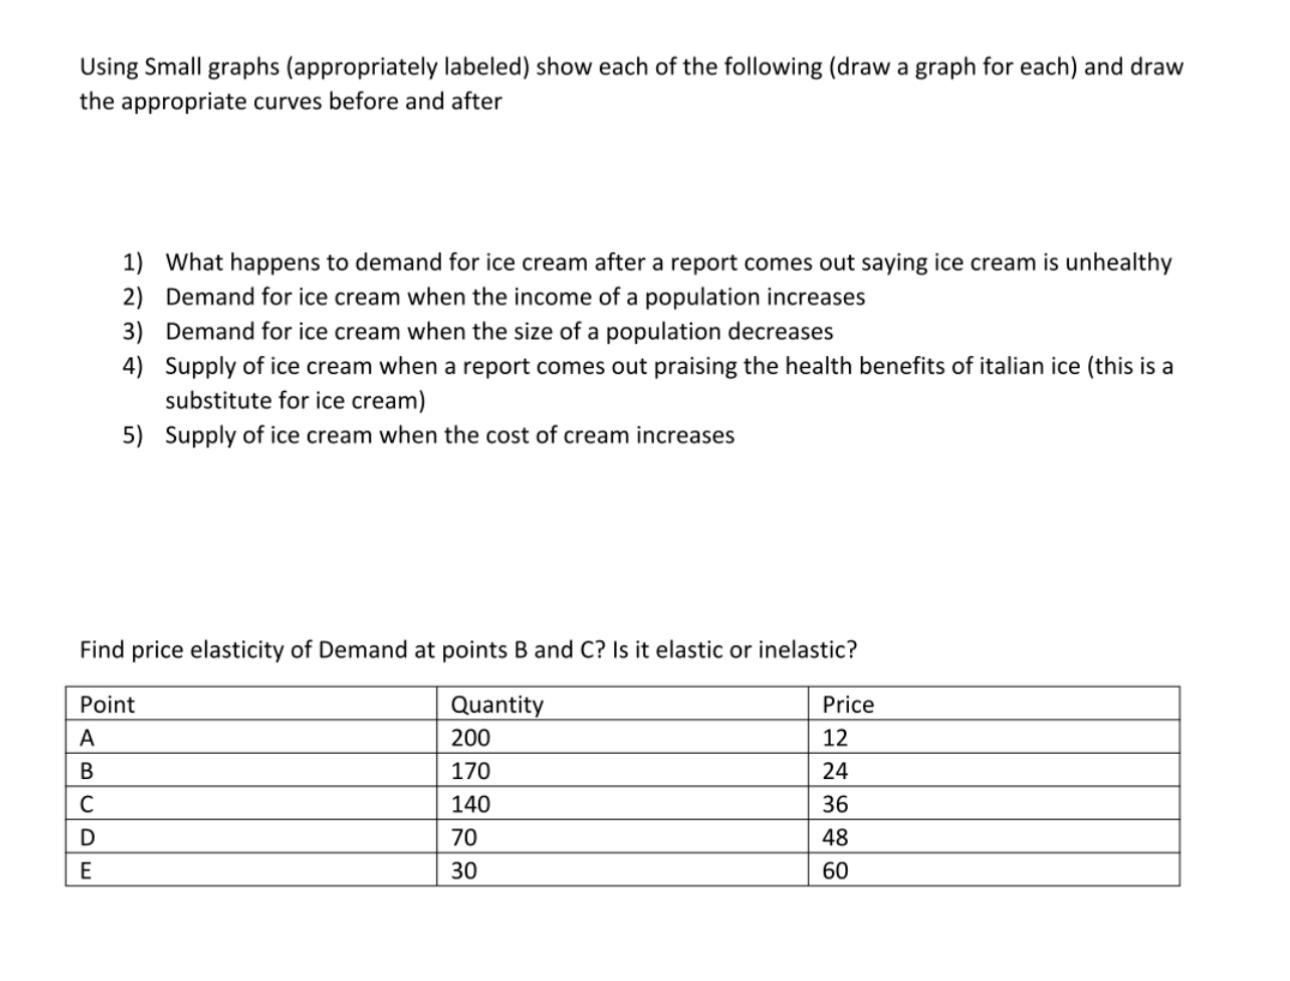
Find price elasticity of Demand at points B and C Is it elastic or inelastic?
tablePointQuantity,PriceABCDE
Step by Step Solution
There are 3 Steps involved in it
1 Expert Approved Answer
Step: 1 Unlock

Question Has Been Solved by an Expert!
Get step-by-step solutions from verified subject matter experts
Step: 2 Unlock
Step: 3 Unlock