

Question: Using spreadsheets to solve complex problems is a key competence - in fact a requirement for many middle management positions in the workplace. Corporate finance
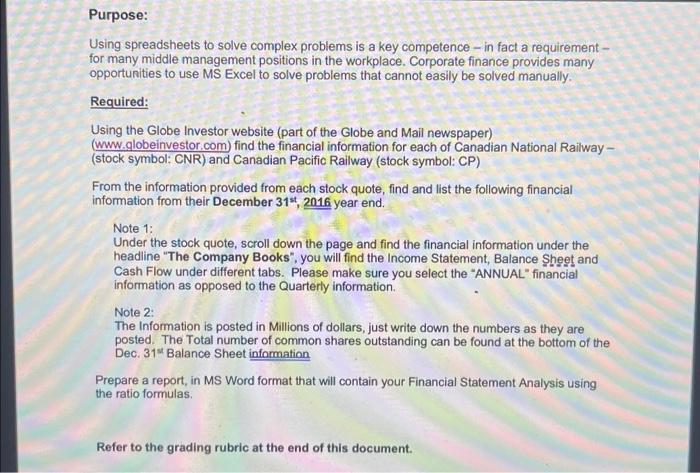
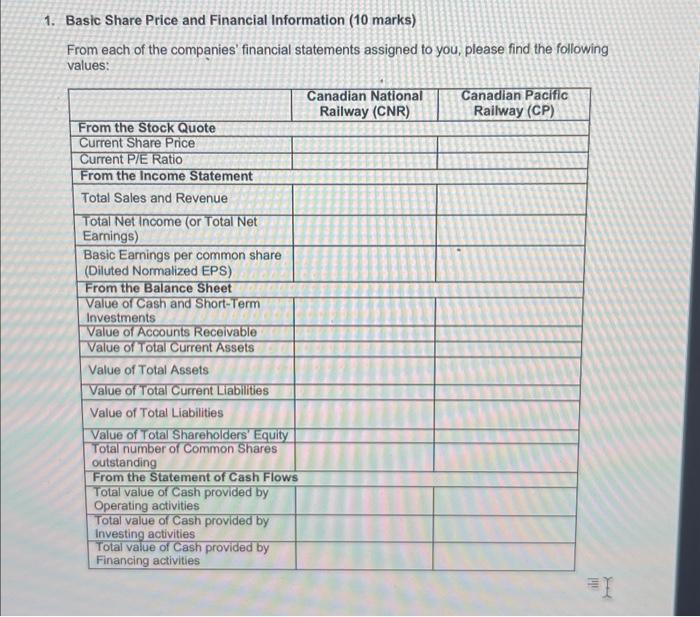
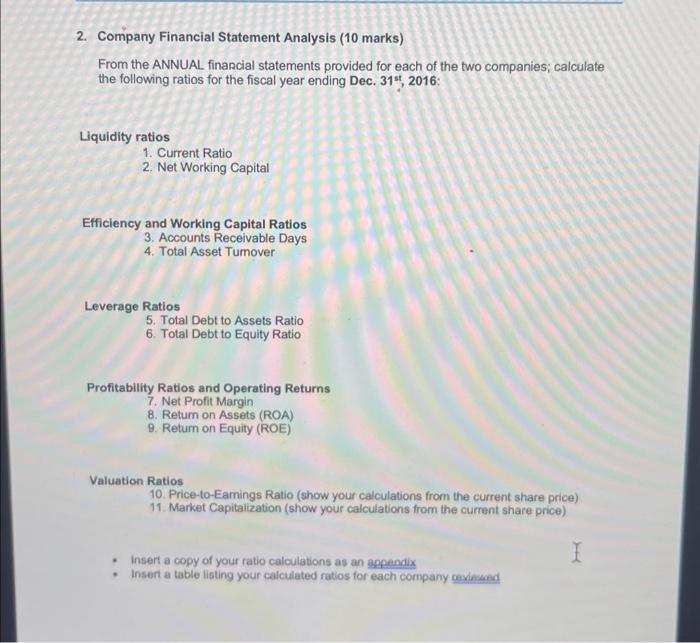
Using spreadsheets to solve complex problems is a key competence - in fact a requirement for many middle management positions in the workplace. Corporate finance provides many opportunities to use MS Excel to solve problems that cannot easily be solved manually. Required: Using the Globe Investor website (part of the Globe and Mail newspaper) (www.globeinvestor.com) find the financial information for each of Canadian National Railway (stock symbol: CNR) and Canadian Pacific Railway (stock symbol: CP) From the information provided from each stock quote, find and list the following financial information from their December 31st, 2016 year end. Note 1: Under the stock quote, scroll down the page and find the financial information under the headline "The Company Books", you will find the Income Statement, Balance Sheet and Cash Flow under different tabs. Please make sure you select the "ANNUAL" financial information as opposed to the Quarterly information. Note 2: The Information is posted in Millions of dollars, just write down the numbers as they are posted. The Total number of common shares outstanding can be found at the bottom of the Dec. 31s Balance Sheet information Prepare a report, in MS Word format that will contain your Financial Statement Analysis using the ratio formulas. Refer to the grading rubric at the end of this document. 1. Basic Share Price and Financial Information (10 marks) From each of the companies' financial statements assigned to you, please find the following 2. Company Financial Statement Analysis (10 marks) From the ANNUAL financial statements provided for each of the two companies; calculate the following ratios for the fiscal year ending Dec. 31st,2016 : Liquidity ratios 1. Current Ratio 2. Net Working Capital Efficiency and Working Capital Ratios 3. Accounts Recelvable Days 4. Total Asset Tumover Leverage Ratios 5. Total Debt to Assets Ratio 6. Total Debt to Equity Ratio Profitability Ratios and Operating Returns 7. Net Profit Margin 8. Return on Assets (ROA) 9. Return on Equity (ROE) Valuation Ratios 10. Price-to-Eamings Ratio (show your calculations from the current share price) 11. Market Capitalization (show your calculations from the current share price) - Insert a copy of your ratio calculations as an appendix - Insert a table listing your calculated ratios for each company gevimand
Step by Step Solution
There are 3 Steps involved in it

Get step-by-step solutions from verified subject matter experts