Question: Using SPSS to solve the following question (Data Analysis on Compensated Dating) Part A. o Research framework: Materialism Gender Attitudes toward compensated dating Normlessness o
Using SPSS to solve the following question
(Data Analysis on Compensated Dating)
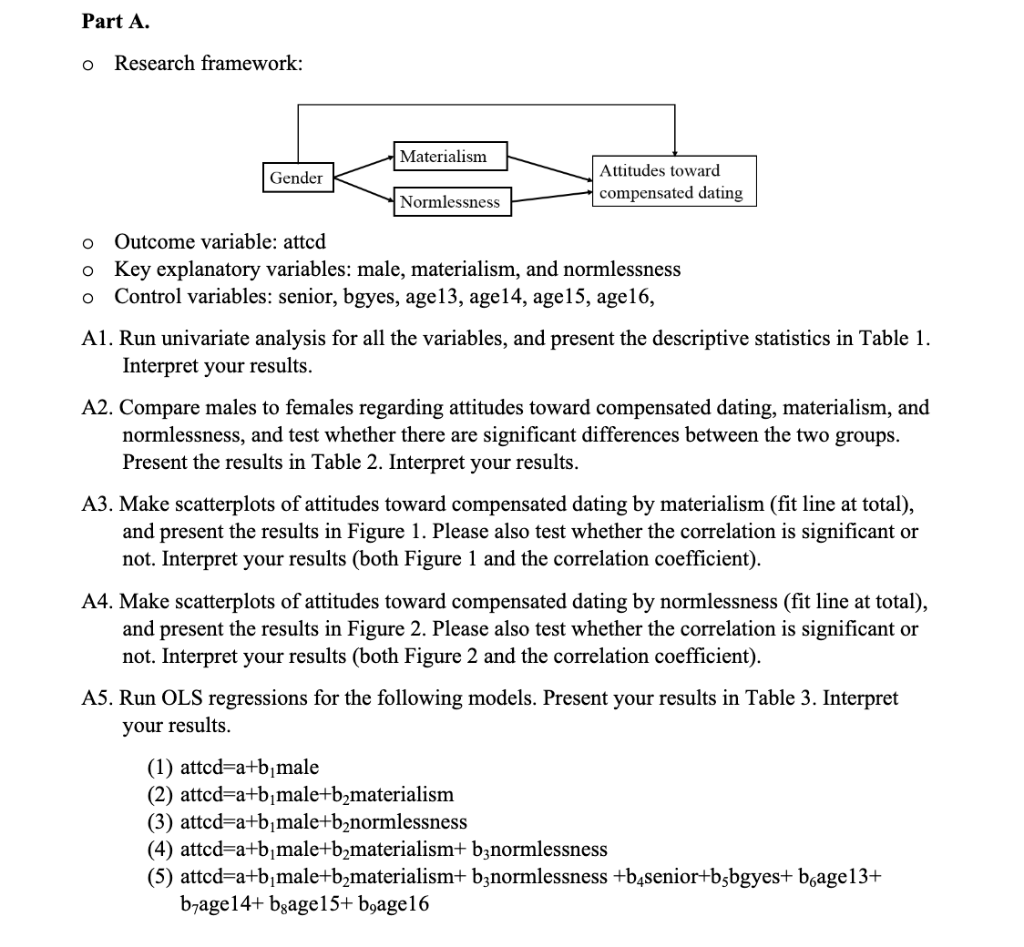
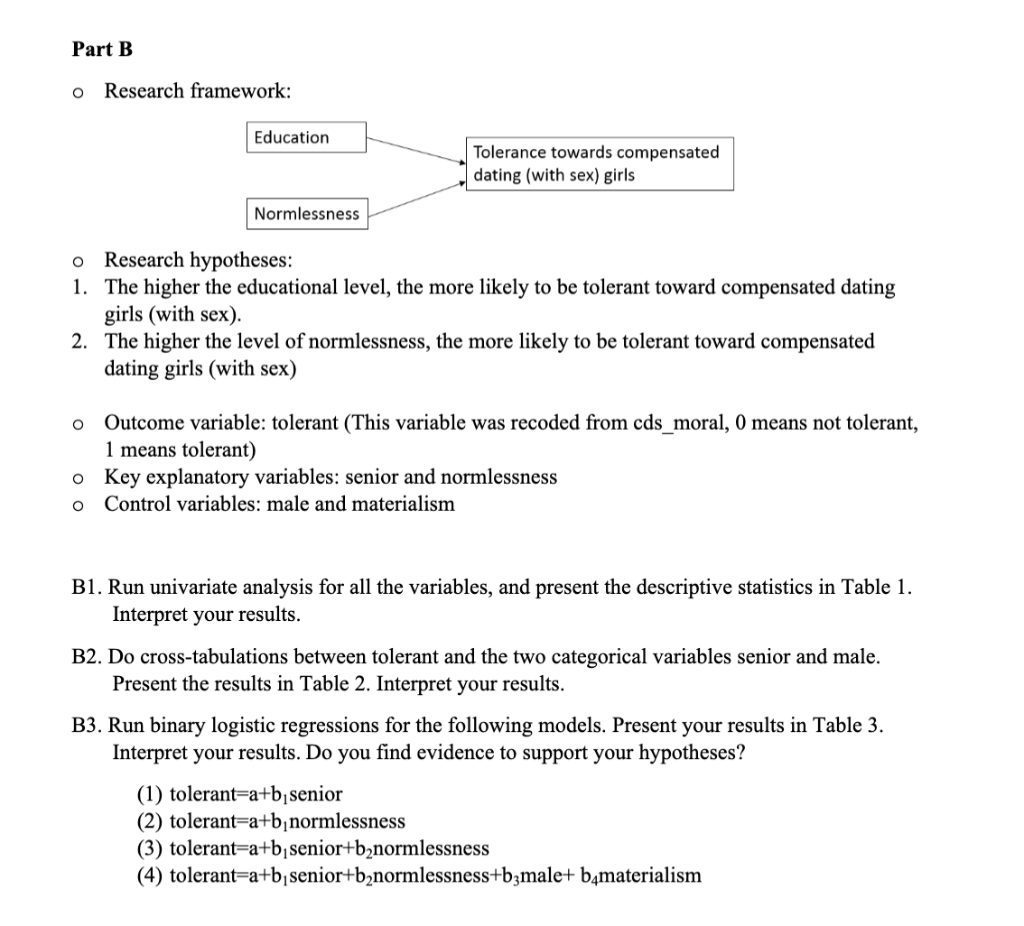
Part A. o Research framework: Materialism Gender Attitudes toward compensated dating Normlessness o O Outcome variable: atted o Key explanatory variables: male, materialism, and normlessness Control variables: senior, bgyes, age13, age14, age15, age16, A1. Run univariate analysis for all the variables, and present the descriptive statistics in Table 1. Interpret your results. A2. Compare males to females regarding attitudes toward compensated dating, materialism, and normlessness, and test whether there are significant differences between the two groups. Present the results in Table 2. Interpret your results. A3. Make scatterplots of attitudes toward compensated dating by materialism (fit line at total), and present the results in Figure 1. Please also test whether the correlation is significant or not. Interpret your results (both Figure 1 and the correlation coefficient). A4. Make scatterplots of attitudes toward compensated dating by normlessness (fit line at total), and present the results in Figure 2. Please also test whether the correlation is significant or not. Interpret your results (both Figure 2 and the correlation coefficient). A5. Run OLS regressions for the following models. Present your results in Table 3. Interpret your results. (1) attcd=a+b male (2) attcd=a+b male+bymaterialism (3) attcd=a+b male+bnormlessness (4) attcd=a+b male+b materialism+ b3normlessness (5) attcd=a+b]male+bmaterialism+ bznormlessness +b4senior+b3bgyes+ bgage13+ brage14+ bgage15+ bgage16 Part B Research framework: Education Tolerance towards compensated dating (with sex) girls Normlessness o Research hypotheses: 1. The higher the educational level, the more likely to be tolerant toward compensated dating girls (with sex). 2. The higher the level of normlessness, the more likely to be tolerant toward compensated dating girls (with sex) o Outcome variable: tolerant (This variable was recoded from cds_moral, 0 means not tolerant, 1 means tolerant) o Key explanatory variables: senior and normlessness Control variables: male and materialism O B1. Run univariate analysis for all the variables, and present the descriptive statistics in Table 1. Interpret your results. B2. Do cross-tabulations between tolerant and the two categorical variables senior and male. Present the results in Table 2. Interpret your results. B3. Run binary logistic regressions for the following models. Present your results in Table 3. Interpret your results. Do you find evidence to support your hypotheses? (1) tolerant=a+b senior (2) tolerant=a+b normlessness (3) tolerant=a+b senior+b2normlessness (4) tolerant=a+b senior+bnormlessness+bzmale+ b materialism Part A. o Research framework: Materialism Gender Attitudes toward compensated dating Normlessness o O Outcome variable: atted o Key explanatory variables: male, materialism, and normlessness Control variables: senior, bgyes, age13, age14, age15, age16, A1. Run univariate analysis for all the variables, and present the descriptive statistics in Table 1. Interpret your results. A2. Compare males to females regarding attitudes toward compensated dating, materialism, and normlessness, and test whether there are significant differences between the two groups. Present the results in Table 2. Interpret your results. A3. Make scatterplots of attitudes toward compensated dating by materialism (fit line at total), and present the results in Figure 1. Please also test whether the correlation is significant or not. Interpret your results (both Figure 1 and the correlation coefficient). A4. Make scatterplots of attitudes toward compensated dating by normlessness (fit line at total), and present the results in Figure 2. Please also test whether the correlation is significant or not. Interpret your results (both Figure 2 and the correlation coefficient). A5. Run OLS regressions for the following models. Present your results in Table 3. Interpret your results. (1) attcd=a+b male (2) attcd=a+b male+bymaterialism (3) attcd=a+b male+bnormlessness (4) attcd=a+b male+b materialism+ b3normlessness (5) attcd=a+b]male+bmaterialism+ bznormlessness +b4senior+b3bgyes+ bgage13+ brage14+ bgage15+ bgage16 Part B Research framework: Education Tolerance towards compensated dating (with sex) girls Normlessness o Research hypotheses: 1. The higher the educational level, the more likely to be tolerant toward compensated dating girls (with sex). 2. The higher the level of normlessness, the more likely to be tolerant toward compensated dating girls (with sex) o Outcome variable: tolerant (This variable was recoded from cds_moral, 0 means not tolerant, 1 means tolerant) o Key explanatory variables: senior and normlessness Control variables: male and materialism O B1. Run univariate analysis for all the variables, and present the descriptive statistics in Table 1. Interpret your results. B2. Do cross-tabulations between tolerant and the two categorical variables senior and male. Present the results in Table 2. Interpret your results. B3. Run binary logistic regressions for the following models. Present your results in Table 3. Interpret your results. Do you find evidence to support your hypotheses? (1) tolerant=a+b senior (2) tolerant=a+b normlessness (3) tolerant=a+b senior+b2normlessness (4) tolerant=a+b senior+bnormlessness+bzmale+ b materialism


