

Question: using Standard & Poor's Database Examine the ratios and comment on the financial and business health of the firm based on an analysis of the
using Standard & Poor's Database
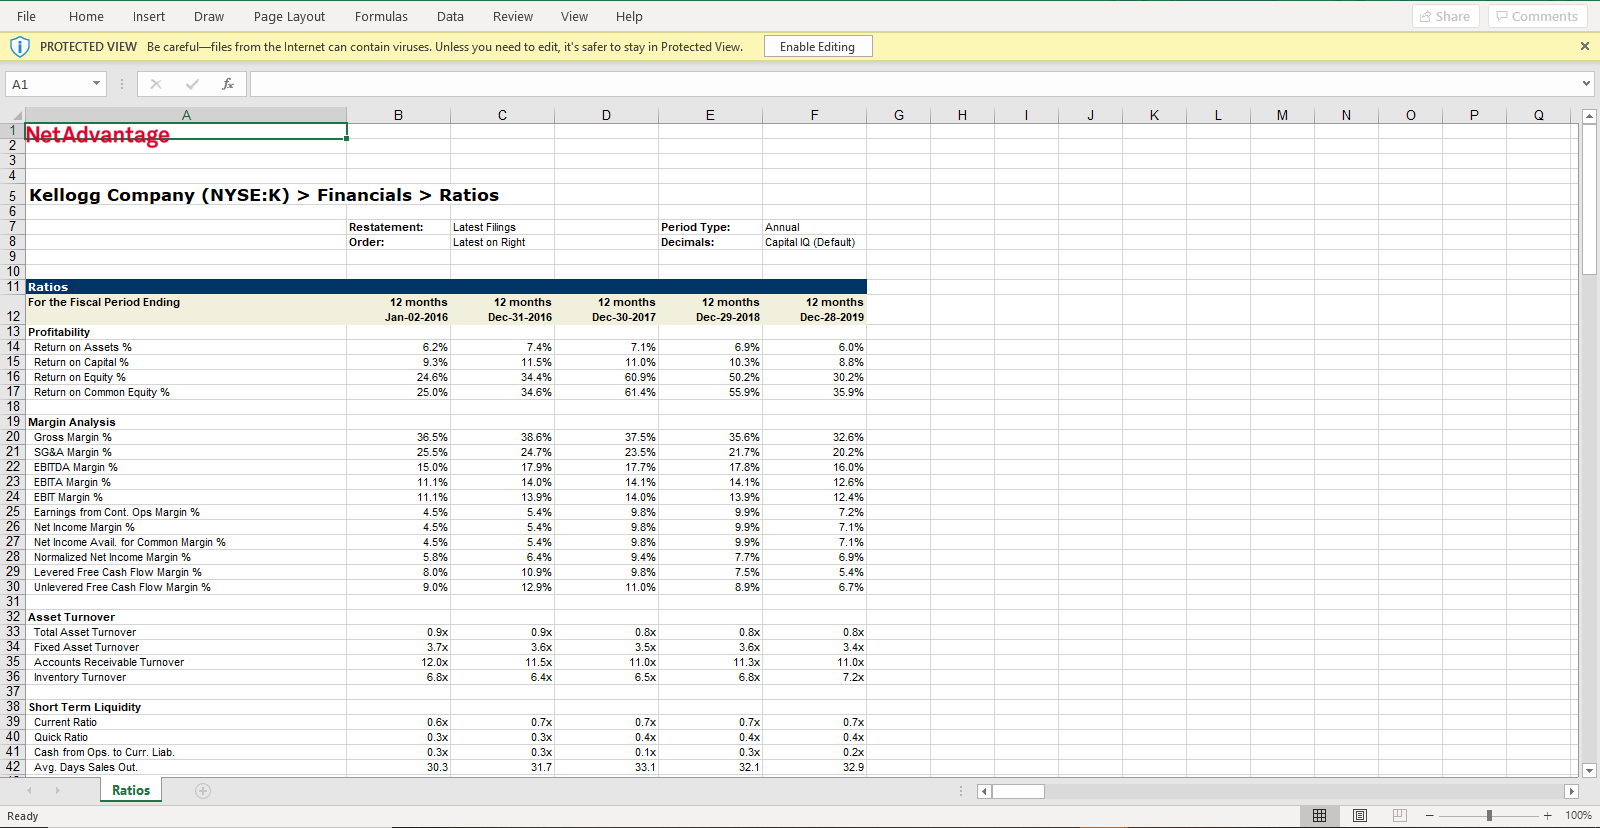
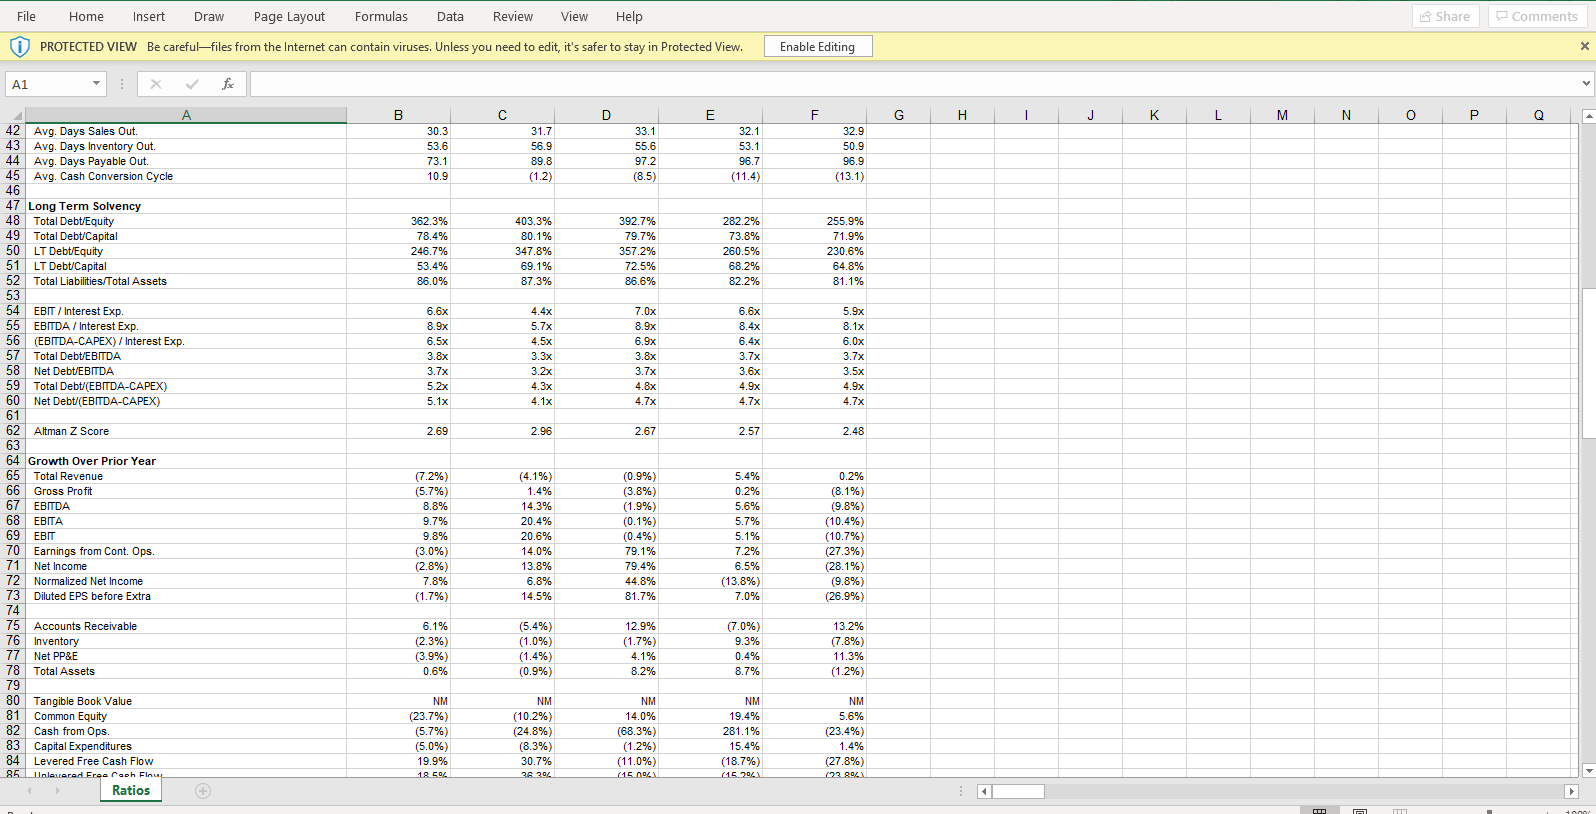
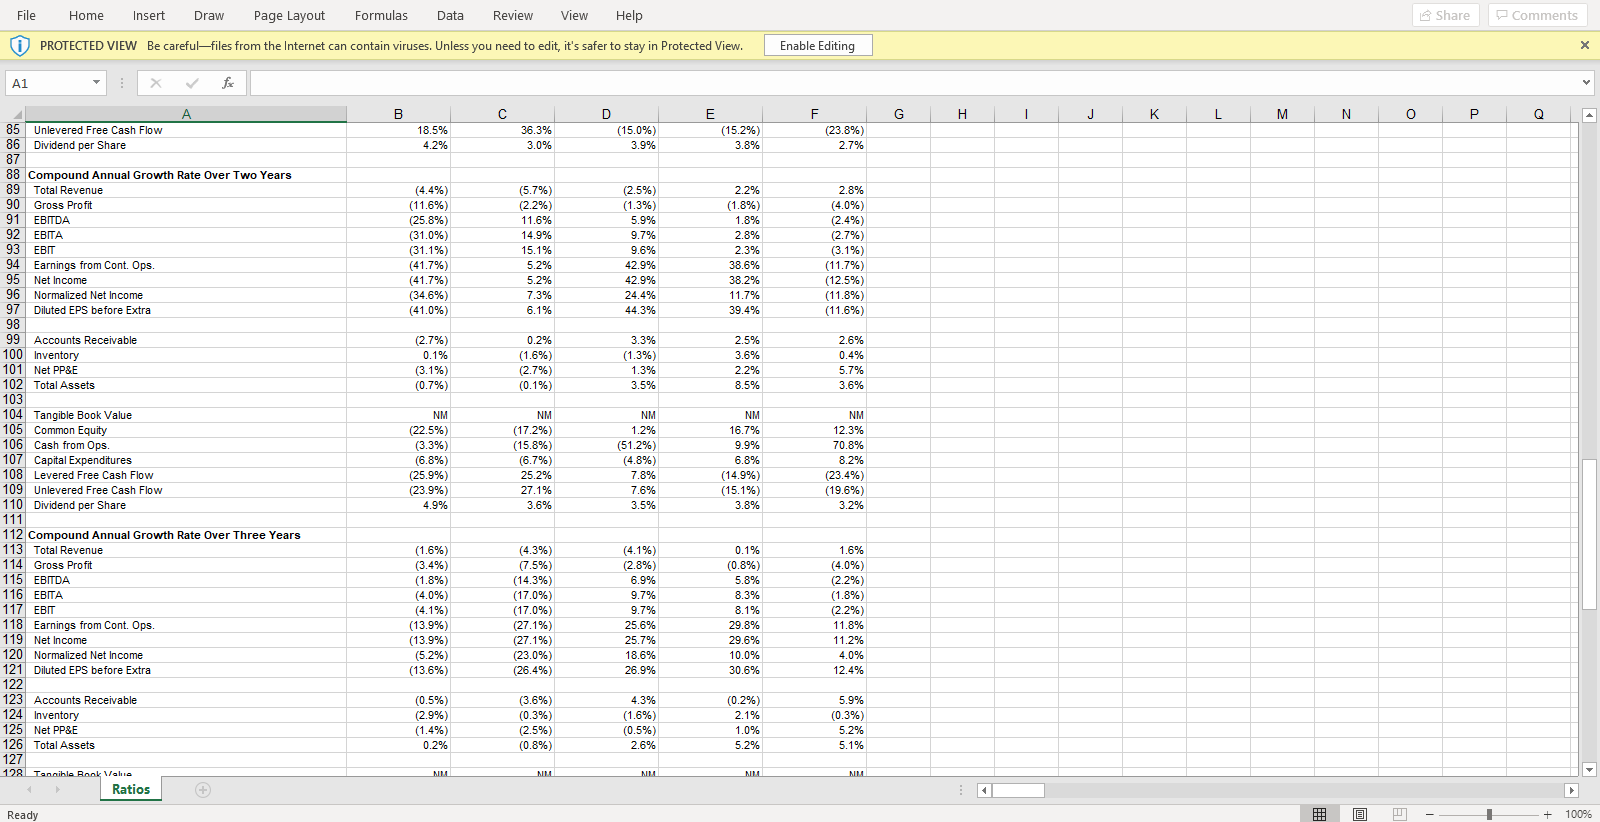
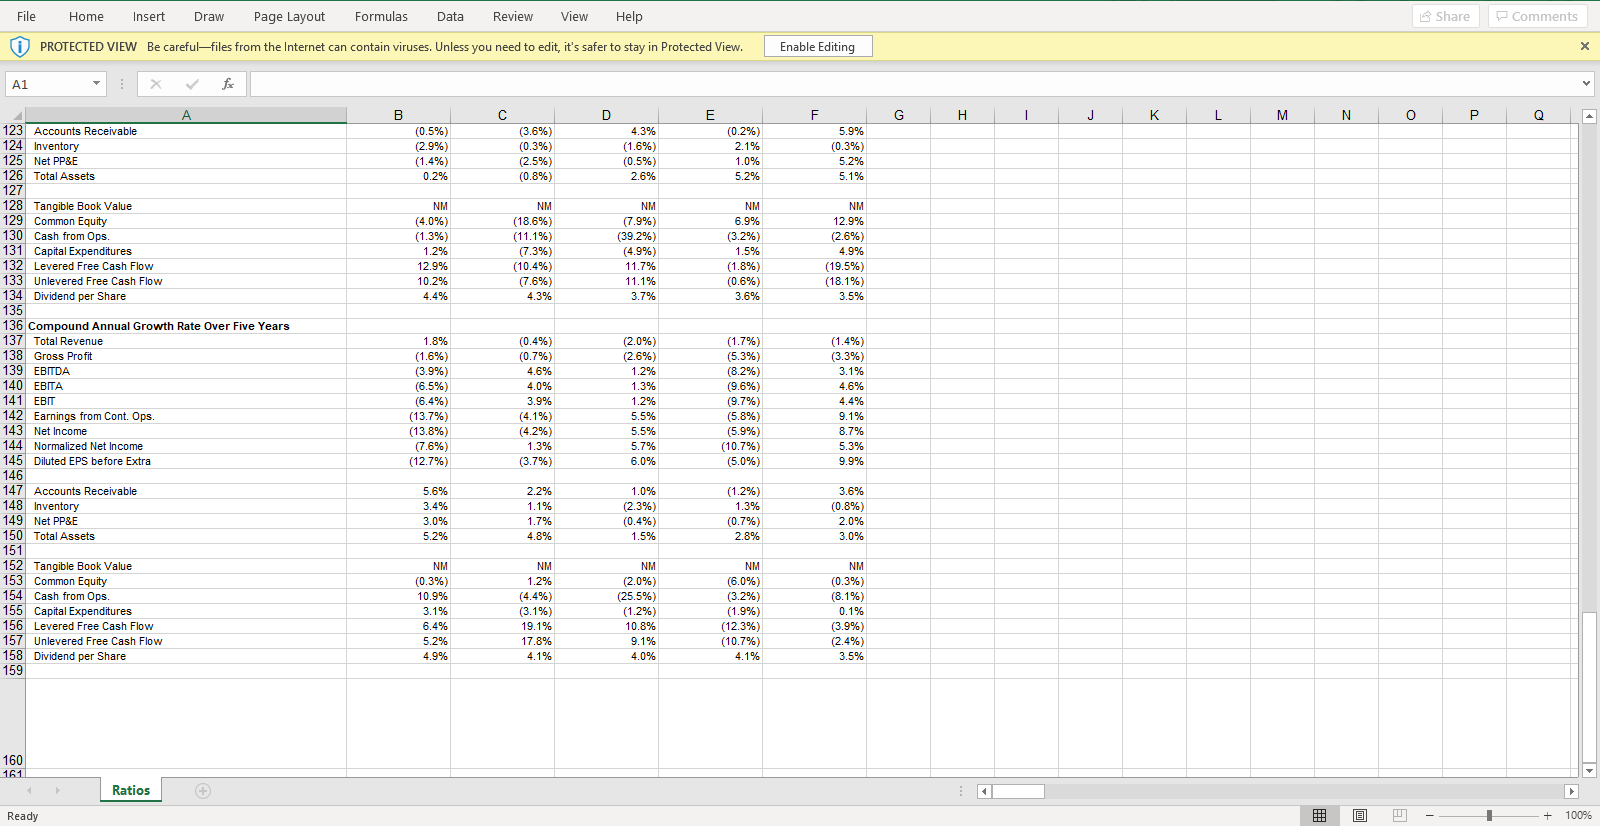
Examine the ratios and comment on the financial and business health of the firm based on an analysis of the ratios
When you do your ratio analysis, focus on the trends that you are seeing
Is the trend beneficial to the firm or detrimental (a weakness)
Share Comments File Home Insert Draw Page Layout Formulas Data Review View Help PROTECTED VIEW Be carefulfiles from the Internet can contain viruses. Unless you need to edit, it's safer to stay in Protected View Enable Editing Al B C D E F G H I J K L M N O P Q LA 1 NetAdvantage - + Woo 5 Kellogg Company (NYSE:K) > Financials > Ratios Restatement: Order: Latest Filings Latest on Right Period Type: Decimals: Annual Capital IQ (Default) 12 months Jan-02-2016 12 months Dec-31-2016 12 months Dec-30-2017 12 months Dec-29-2018 12 months Dec-28-2019 11 Ratios For the Fiscal Period Ending 12 13 Profitability 14 Return on Assets % 15 Return on Capital % 16 Return on Equity % 17 Return on Common Equity % 6.2% 9.3% 24.6% 25.0% 7.4% 11.5% 34.4% 34.6% 7.1% 11.0% 60.9% 61.4% 6.9% 10.3% 50.2% 55.9% 6.0% 8.8% 30.2% 35.9% 18 19 Margin Analysis 20 Gross Margin % 21 SG&A Margin % 22 EBITDA Margin % 23 EBITA Margin % 24 EBIT Margin % 25 Earnings from Cont. Ops Margin % 26 Net Income Margin % 27 Net Income Avail. for Common Margin % 28 Normalized Net Income Margin% 29 Levered Free Cash Flow Margin % 30 Unlevered Free Cash Flow Margin % 36.5% 25.5% 15.0% 11.1% 11.1% 4.5% 4.5% 4.5% 5.8% 8.0% 9.0% 38.6% 24.7% 17.9% 14.0% 13.9% 5.4% 5.4% 5.4% 6.4% 10.9% 12.9% 37.5% 23.5% 17.7% 14.1% 14.0% 9.8% 9.8% 9.8% 9.4% 9.8% 11.0% 35.6% 21.7% 17.8% 14.1% 13.9% 9.9% 9.9% 9.9% 7.7% 7.5% 8.9% 32.6% 20.2% 16.0% 12.6% 12.4% 7.2% 7.1% 7.1% 6.9% 5.4% 6.7% 31 32 Asset Turnover 33 Total Asset Turnover 34 Fixed Asset Turnover 35 Accounts Receivable Turnover 36 Inventory Turnover 0.9x 3.7x 12.0x 6.8x 0.9x 3.6x 11.5x 6.4x 0.8x 3.5x 11.0x 6.5x 0.8x 3.6x 11.3x 0.8x 3.4x 11.0x 7.2x 6.8x 37 38 Short Term Liquidity 39 Current Ratio 40 Quick Ratio 41 Cash from Ops. to Curr. Liab. 42 Avg. Days Sales Out. Ratios 0.6x 0.3x 0.3x 30.3 0.7x 0.3x 0.3x 31.7 0.7x 0.4x 0.1x 33.1 0.7x 0.4x 0.3x 32.1 0.7x 0.4x 0.2x 32.9 Ready @ -- - + 100% Share Comments File Home Insert Draw Page Layout Formulas Data Review View Help PROTECTED VIEW Be carefulfiles from the Internet can contain viruses. Unless you need to edit, it's safer to stay in Protected View Enable Editing B C D F G H I J K L M N O P Q LA 30.3 53.6 73.1 10.9 31.7 56.9 89.8 (1.2) 33.1 55.6 97.2 (8.5) 32.1 53.1 96.7 (11.4) 32.9 50.9 96.9 (13.1) 42 Avg. Days Sales Out. 43 Avg. Days Inventory Out. 44 Avg. Days Payable Out. 45 Avg. Cash Conversion Cycle 46 47 Long Term Solvency 48 Total Debt/Equity 49 Total Debt/Capital 50 LT Debt/Equity 51 LT Debt/Capital 52 Total Liabilities/Total Assets 362.3% 78.4% 246.7% 53.4% 86.0% 403.3% 80.1% 347.8% 69.1% 87.3% 392.7% 79.7% 357.2% 72.5% 86.6% 282.2% 73.8% 260.5% 68.2% 82.2% 255.9% 71.9% 230.6% 64.8% 81.1% 53 54 EBIT / Interest Exp. 55 EBITDA / Interest Exp. 56 (EBITDA-CAPEX) / Interest Exp. 57 Total Debt/EBITDA 58 Net Debt/EBITDA 59 Total Debt/(EBITDA-CAPEX) 60 Net Debt/(EBITDA-CAPEX) 6.6x 8.9x 6.5x 3.8x 3.7x 5.2x 5.1x 4.4x 5.7x 4.5x 3.3x 3.2x 4.3x 4.1x 7.0x 8.9x 6.9x 3.8x 6.6x 8. 4x 6.4x 3.7x 3.6x 4.9% 4.7x 5.9x 8.1x 6.0x 3.7x 3.7% 3.5% 4.9% 4.7% 4.7% 61 2.69 2.96 2.67 2.57 2.48 62 Altman Z Score 63 64 Growth Over Prior Year 65 Total Revenue 66 Gross Profit 67 EBITDA 68 EBITA 69 EBIT 70 Earnings from Cont. Ops. 71 Net Income 72 Normalized Net Income 73 Diluted EPS before Extra 74 75 Accounts Receivable 76 Inventory 77 Net PP&E 78 Total Assets (7.2%) (5.7%) 8.8% 9.7% 9.8% (3.0%) (2.8%) 7.8% (1.7%) (4.1%) 1.4% 14.3% 20.4% 20.6% 14.0% 13.8% 6.8% 14.5% (0.9%) (3.8%) (1.9%) (0.1%) (0.4%) 79.1% 79.4% 44.8% 81.7% 5.4% 0.2% 5.6% 5.7% 5.1% 7.2% 6.5% (13.8%) 7.0% 0.2% (8.1%) (9.8%) (10.4%) (10.7%) (27.3%) (28.1%) (9.8%) (26.9%) 6.1% (2.3%) (3.9%) 0.6% (5.4%) (1.0%) (1.4%) (0.9%) 12.9% (1.7%) 4.1% 8.2% (7.0%) 9.3% 0.4% 8.7% 13.2% (7.8%) 11.3% (1.2%) 79 NM 5.6% 80 Tangible Book Value 81 Common Equity 82 Cash from Ops. 83 Capital Expenditures 84 Levered Free Cash Flow 85 linlawara Frearach Flnu Ratios NM (23.7%) (5.7%) (5.0%) 19.9% 18 COC NM (10.2%) (24.8%) (8.3%) 30.7% 26204 NM 14.0% (68.3%) (1.2%) (11.0%) (15 00 NM 19.4% 281.1% 15.4% (18.7%) (15704 (23.4%) 1.4% (27.8%) 122 804 Share Comments File Home Insert Draw Page Layout Formulas Data Review View Help PROTECTED VIEW Be carefulfiles from the Internet can contain viruses. Unless you need to edit, it's safer to stay in Protected View Enable Editing A1 : for B C D F G H I J K L M N O P Q LA 85 86 Unlevered Free Cash Flow Dividend per Share 18.5% 4.2% 36.3% 3.0% (15.0%) 3.9% (15.2%) 3.8% (23.8%) 2.7% 87 (4.4%) (11.6%) (25.8%) (31.0%) (31.1%) (41.7%) (41.7%) (34.6%) (41.0%) (5.7%) (2.2%) 11.6% 14.9% 15.1% (2.5%) (1.3%) 5.9% 9.7% 9.6% 42.9% 42.9% 24.4% 44.3% 2.2% (1.8%) 1.8% 2.8% 2.3% 38.6% 38.2% 11.7% 39.4% 2.8% (4.0%) (2.4%) (2.7%) (3.1%) (11.7%) (12.5%) (11.8%) (11.6%) 5.2% 5.2% 7.3% 6.1% (2.7%) 0.1% (3.1%) (0.7%) 0.2% (1.6%) (2.7%) (0.1%) 3.3% (1.3%) 1.3% 3.5% 2.5% 3.6% 2.2% 8.5% 2.6% 0.4% 5.7% 3.6% NM 88 Compound Annual Growth Rate Over Two Years 89 Total Revenue 90 Gross Profit 91 EBITDA 92 EBITA 93 EBIT 94 Earnings from Cont. Ops. 95 Net Income 96 Normalized Net Income 97 Diluted EPS before Extra 98 99 Accounts Receivable 100 Inventory 101 Net PPSE 102 Total Assets 103 104 Tangible Book Value 105 Common Equity 106 Cash from Ops 107 Capital Expenditures 108 Levered Free Cash Flow 109 Unlevered Free Cash Flow 110 Dividend per Share 111 112 Compound Annual Growth Rate Over Three Years 113 Total Revenue 114 Gross Profit 115 EBITDA 116 EBITA 117 EBIT 118 Earnings from Cont. Ops. 119 Net Income 120 Normalized Net Income 121 Diluted EPS before Extra 122 123 Accounts Receivable 124 Inventory 125 Net PPE 126 Total Assets 127 128 Tangible Book Value Ratios NM (22.5%) (3.3%) (6.8%) (25.9%) (23.9%) 4.9% (17.2%) (15.8%) (6.7%) 25.2% 27.1% 3.6% NM 1.2% (51.2%) (4.8%) 7.8% 7.6% 3.5% NM 16.7% 9.9% 6.8% (14.9%) (15.1%) 3.8% NM 12.3% 70.8% 8.2% (23.4%) (19.6%) 3.2% (1.6%) (3.4%) (1.8%) (4.0%) (4.1%) (13.9%) (13.9%) (5.2%) (13.6%) (4.3%) (7.5%) (14.3%) (17.0%) (17.0%) (27.1%) (27.1%) (23.0%) (26.4%) (4.1%) (2.8%) 6.9% 9.7% 9.7% 25.6% 25.7% 18.6% 26.9% 0.1% (0.8%) 5.8% 8.3% 8.1% 29.8% 29.6% 10.0% 30.6% 1.6% (4.0%) (2.2%) (1.8%) (2.2%) 11.8% 11.2% 4.0% 12.4% (0.5%) (2.9%) (1.4%) 0.2% (3.6%) (0.3%) (2.5%) (0.8%) 4.3% (1.6%) (0.5%) 2.6% (0.2%) 2.1% 1.0% 5.2% 5.9% (0.3%) 5.2% 5.1% NM Ready @ - - + 100% Share Comments File Home Insert Draw Page Layout Formulas Data Review View Help PROTECTED VIEW Be carefulfiles from the Internet can contain viruses. Unless you need to edit, it's safer to stay in Protected View Enable Editing A1 - X foc A F G H I J K L M N O P Q LA 123 Accounts Receivable 124 Inventory 125 Net PPSE (0.5%) (2.9%) (1.4%) 0.2% (3.6%) (0.3%) (2.5%) (0.8%) 4.3% (1.6%) (0.5%) 2.6% (0.2%) 2.1% 1.0% 5.2% 5.9% (0.3%) 5.2% 5.1% 126 Tota NM (4.0%) (1.3%) 1.2% 12.9% 10.2% 4.4% NM (18.6%) (11.1%) (7.3%) (10.4%) (7.6%) 4.3% NM (7.9%) (39.2%) (4.9%) 11.7% 11.1% 3.7% NM 6.9% (3.2%) 1.5% (1.8%) (0.6%) 3.6% NM 12.9% (2.6%) 4.9% (19.5%) (18.1%) 3.5% 127 128 Tangible Book Value 129 Common Equity 130 Cash from Ops. 131 Capital Expenditures 132 Levered Free Cash Flow 133 Unlevered Free Cash Flow 134 Dividend per Share 135 136 Compound Annual Growth Rate Over Five Years 137 Total Revenue 138 Gross Profit 139 EBITDA 140 EBITA 141 EBIT 142 Earnings from Cont. Ops 143 Net Income 144 Normalized Net Income 145 Diluted EPS before Extra 146 147 Accounts Receivable 148 Inventory 149 Net PPSE 150 Total Assets 151 152 Tangible Book Value 153 Common Equity 154 Cash from Ops. 155 Capital Expenditures 156 Levered Free Cash Flow 157 Unlevered Free Cash Flow 158 Dividend per Share 1.8% (1.6%) (3.9%) (6.5%) (6.4%) (13.7%) (13.8%) (7.6%) (12.7%) (0.4%) (0.7%) 4.6% 4.0% 3.9% (4.1%) (4.2%) 1.3% (3.7%) (2.0%) (2.6% 1.2% 1.3% 1.2% 5.5% 5.5% 5.7% 6.0% (1.7%) (5.3%) (8.2%) (9.6%) (9.7%) (5.8%) (5.9%) (10.7%) (5.0%) (1.4%) (3.3%) 3.1% 4.6% 4.4% 9.1% 8.7% 5.3% 9.9% 5.6% 3.4% 3.0% 5.2% 2.2% 1.1% 1.7% 4.8% 1.0% (2.3%) (0.4%) 1.5% (1.2%) 1.3% (0.7%) 2.8% 3.6% (0.8%) 2.0% 3.0% SE DESSEEEE NM (0.3%) 10.9% 3.1% 6.4% 5.2% 4.9% NM 1.2% (4.4%) (3.1%) 19.1% 17.8% 4.1% NM (2.0%) (25.5%) (1.2%) 10.8% 9.1% 4.0% NM (6.0%) (3.2%) (1.9%) (12.3%) (10.7%) 4.1% NM (0.3%) (8.1%) 0.1% (3.9%) (2.4%) 3.5% 159 160 1611 Ratios Ready E @ J- - + 100% Share Comments File Home Insert Draw Page Layout Formulas Data Review View Help PROTECTED VIEW Be carefulfiles from the Internet can contain viruses. Unless you need to edit, it's safer to stay in Protected View Enable Editing Al B C D E F G H I J K L M N O P Q LA 1 NetAdvantage - + Woo 5 Kellogg Company (NYSE:K) > Financials > Ratios Restatement: Order: Latest Filings Latest on Right Period Type: Decimals: Annual Capital IQ (Default) 12 months Jan-02-2016 12 months Dec-31-2016 12 months Dec-30-2017 12 months Dec-29-2018 12 months Dec-28-2019 11 Ratios For the Fiscal Period Ending 12 13 Profitability 14 Return on Assets % 15 Return on Capital % 16 Return on Equity % 17 Return on Common Equity % 6.2% 9.3% 24.6% 25.0% 7.4% 11.5% 34.4% 34.6% 7.1% 11.0% 60.9% 61.4% 6.9% 10.3% 50.2% 55.9% 6.0% 8.8% 30.2% 35.9% 18 19 Margin Analysis 20 Gross Margin % 21 SG&A Margin % 22 EBITDA Margin % 23 EBITA Margin % 24 EBIT Margin % 25 Earnings from Cont. Ops Margin % 26 Net Income Margin % 27 Net Income Avail. for Common Margin % 28 Normalized Net Income Margin% 29 Levered Free Cash Flow Margin % 30 Unlevered Free Cash Flow Margin % 36.5% 25.5% 15.0% 11.1% 11.1% 4.5% 4.5% 4.5% 5.8% 8.0% 9.0% 38.6% 24.7% 17.9% 14.0% 13.9% 5.4% 5.4% 5.4% 6.4% 10.9% 12.9% 37.5% 23.5% 17.7% 14.1% 14.0% 9.8% 9.8% 9.8% 9.4% 9.8% 11.0% 35.6% 21.7% 17.8% 14.1% 13.9% 9.9% 9.9% 9.9% 7.7% 7.5% 8.9% 32.6% 20.2% 16.0% 12.6% 12.4% 7.2% 7.1% 7.1% 6.9% 5.4% 6.7% 31 32 Asset Turnover 33 Total Asset Turnover 34 Fixed Asset Turnover 35 Accounts Receivable Turnover 36 Inventory Turnover 0.9x 3.7x 12.0x 6.8x 0.9x 3.6x 11.5x 6.4x 0.8x 3.5x 11.0x 6.5x 0.8x 3.6x 11.3x 0.8x 3.4x 11.0x 7.2x 6.8x 37 38 Short Term Liquidity 39 Current Ratio 40 Quick Ratio 41 Cash from Ops. to Curr. Liab. 42 Avg. Days Sales Out. Ratios 0.6x 0.3x 0.3x 30.3 0.7x 0.3x 0.3x 31.7 0.7x 0.4x 0.1x 33.1 0.7x 0.4x 0.3x 32.1 0.7x 0.4x 0.2x 32.9 Ready @ -- - + 100% Share Comments File Home Insert Draw Page Layout Formulas Data Review View Help PROTECTED VIEW Be carefulfiles from the Internet can contain viruses. Unless you need to edit, it's safer to stay in Protected View Enable Editing B C D F G H I J K L M N O P Q LA 30.3 53.6 73.1 10.9 31.7 56.9 89.8 (1.2) 33.1 55.6 97.2 (8.5) 32.1 53.1 96.7 (11.4) 32.9 50.9 96.9 (13.1) 42 Avg. Days Sales Out. 43 Avg. Days Inventory Out. 44 Avg. Days Payable Out. 45 Avg. Cash Conversion Cycle 46 47 Long Term Solvency 48 Total Debt/Equity 49 Total Debt/Capital 50 LT Debt/Equity 51 LT Debt/Capital 52 Total Liabilities/Total Assets 362.3% 78.4% 246.7% 53.4% 86.0% 403.3% 80.1% 347.8% 69.1% 87.3% 392.7% 79.7% 357.2% 72.5% 86.6% 282.2% 73.8% 260.5% 68.2% 82.2% 255.9% 71.9% 230.6% 64.8% 81.1% 53 54 EBIT / Interest Exp. 55 EBITDA / Interest Exp. 56 (EBITDA-CAPEX) / Interest Exp. 57 Total Debt/EBITDA 58 Net Debt/EBITDA 59 Total Debt/(EBITDA-CAPEX) 60 Net Debt/(EBITDA-CAPEX) 6.6x 8.9x 6.5x 3.8x 3.7x 5.2x 5.1x 4.4x 5.7x 4.5x 3.3x 3.2x 4.3x 4.1x 7.0x 8.9x 6.9x 3.8x 6.6x 8. 4x 6.4x 3.7x 3.6x 4.9% 4.7x 5.9x 8.1x 6.0x 3.7x 3.7% 3.5% 4.9% 4.7% 4.7% 61 2.69 2.96 2.67 2.57 2.48 62 Altman Z Score 63 64 Growth Over Prior Year 65 Total Revenue 66 Gross Profit 67 EBITDA 68 EBITA 69 EBIT 70 Earnings from Cont. Ops. 71 Net Income 72 Normalized Net Income 73 Diluted EPS before Extra 74 75 Accounts Receivable 76 Inventory 77 Net PP&E 78 Total Assets (7.2%) (5.7%) 8.8% 9.7% 9.8% (3.0%) (2.8%) 7.8% (1.7%) (4.1%) 1.4% 14.3% 20.4% 20.6% 14.0% 13.8% 6.8% 14.5% (0.9%) (3.8%) (1.9%) (0.1%) (0.4%) 79.1% 79.4% 44.8% 81.7% 5.4% 0.2% 5.6% 5.7% 5.1% 7.2% 6.5% (13.8%) 7.0% 0.2% (8.1%) (9.8%) (10.4%) (10.7%) (27.3%) (28.1%) (9.8%) (26.9%) 6.1% (2.3%) (3.9%) 0.6% (5.4%) (1.0%) (1.4%) (0.9%) 12.9% (1.7%) 4.1% 8.2% (7.0%) 9.3% 0.4% 8.7% 13.2% (7.8%) 11.3% (1.2%) 79 NM 5.6% 80 Tangible Book Value 81 Common Equity 82 Cash from Ops. 83 Capital Expenditures 84 Levered Free Cash Flow 85 linlawara Frearach Flnu Ratios NM (23.7%) (5.7%) (5.0%) 19.9% 18 COC NM (10.2%) (24.8%) (8.3%) 30.7% 26204 NM 14.0% (68.3%) (1.2%) (11.0%) (15 00 NM 19.4% 281.1% 15.4% (18.7%) (15704 (23.4%) 1.4% (27.8%) 122 804 Share Comments File Home Insert Draw Page Layout Formulas Data Review View Help PROTECTED VIEW Be carefulfiles from the Internet can contain viruses. Unless you need to edit, it's safer to stay in Protected View Enable Editing A1 : for B C D F G H I J K L M N O P Q LA 85 86 Unlevered Free Cash Flow Dividend per Share 18.5% 4.2% 36.3% 3.0% (15.0%) 3.9% (15.2%) 3.8% (23.8%) 2.7% 87 (4.4%) (11.6%) (25.8%) (31.0%) (31.1%) (41.7%) (41.7%) (34.6%) (41.0%) (5.7%) (2.2%) 11.6% 14.9% 15.1% (2.5%) (1.3%) 5.9% 9.7% 9.6% 42.9% 42.9% 24.4% 44.3% 2.2% (1.8%) 1.8% 2.8% 2.3% 38.6% 38.2% 11.7% 39.4% 2.8% (4.0%) (2.4%) (2.7%) (3.1%) (11.7%) (12.5%) (11.8%) (11.6%) 5.2% 5.2% 7.3% 6.1% (2.7%) 0.1% (3.1%) (0.7%) 0.2% (1.6%) (2.7%) (0.1%) 3.3% (1.3%) 1.3% 3.5% 2.5% 3.6% 2.2% 8.5% 2.6% 0.4% 5.7% 3.6% NM 88 Compound Annual Growth Rate Over Two Years 89 Total Revenue 90 Gross Profit 91 EBITDA 92 EBITA 93 EBIT 94 Earnings from Cont. Ops. 95 Net Income 96 Normalized Net Income 97 Diluted EPS before Extra 98 99 Accounts Receivable 100 Inventory 101 Net PPSE 102 Total Assets 103 104 Tangible Book Value 105 Common Equity 106 Cash from Ops 107 Capital Expenditures 108 Levered Free Cash Flow 109 Unlevered Free Cash Flow 110 Dividend per Share 111 112 Compound Annual Growth Rate Over Three Years 113 Total Revenue 114 Gross Profit 115 EBITDA 116 EBITA 117 EBIT 118 Earnings from Cont. Ops. 119 Net Income 120 Normalized Net Income 121 Diluted EPS before Extra 122 123 Accounts Receivable 124 Inventory 125 Net PPE 126 Total Assets 127 128 Tangible Book Value Ratios NM (22.5%) (3.3%) (6.8%) (25.9%) (23.9%) 4.9% (17.2%) (15.8%) (6.7%) 25.2% 27.1% 3.6% NM 1.2% (51.2%) (4.8%) 7.8% 7.6% 3.5% NM 16.7% 9.9% 6.8% (14.9%) (15.1%) 3.8% NM 12.3% 70.8% 8.2% (23.4%) (19.6%) 3.2% (1.6%) (3.4%) (1.8%) (4.0%) (4.1%) (13.9%) (13.9%) (5.2%) (13.6%) (4.3%) (7.5%) (14.3%) (17.0%) (17.0%) (27.1%) (27.1%) (23.0%) (26.4%) (4.1%) (2.8%) 6.9% 9.7% 9.7% 25.6% 25.7% 18.6% 26.9% 0.1% (0.8%) 5.8% 8.3% 8.1% 29.8% 29.6% 10.0% 30.6% 1.6% (4.0%) (2.2%) (1.8%) (2.2%) 11.8% 11.2% 4.0% 12.4% (0.5%) (2.9%) (1.4%) 0.2% (3.6%) (0.3%) (2.5%) (0.8%) 4.3% (1.6%) (0.5%) 2.6% (0.2%) 2.1% 1.0% 5.2% 5.9% (0.3%) 5.2% 5.1% NM Ready @ - - + 100% Share Comments File Home Insert Draw Page Layout Formulas Data Review View Help PROTECTED VIEW Be carefulfiles from the Internet can contain viruses. Unless you need to edit, it's safer to stay in Protected View Enable Editing A1 - X foc A F G H I J K L M N O P Q LA 123 Accounts Receivable 124 Inventory 125 Net PPSE (0.5%) (2.9%) (1.4%) 0.2% (3.6%) (0.3%) (2.5%) (0.8%) 4.3% (1.6%) (0.5%) 2.6% (0.2%) 2.1% 1.0% 5.2% 5.9% (0.3%) 5.2% 5.1% 126 Tota NM (4.0%) (1.3%) 1.2% 12.9% 10.2% 4.4% NM (18.6%) (11.1%) (7.3%) (10.4%) (7.6%) 4.3% NM (7.9%) (39.2%) (4.9%) 11.7% 11.1% 3.7% NM 6.9% (3.2%) 1.5% (1.8%) (0.6%) 3.6% NM 12.9% (2.6%) 4.9% (19.5%) (18.1%) 3.5% 127 128 Tangible Book Value 129 Common Equity 130 Cash from Ops. 131 Capital Expenditures 132 Levered Free Cash Flow 133 Unlevered Free Cash Flow 134 Dividend per Share 135 136 Compound Annual Growth Rate Over Five Years 137 Total Revenue 138 Gross Profit 139 EBITDA 140 EBITA 141 EBIT 142 Earnings from Cont. Ops 143 Net Income 144 Normalized Net Income 145 Diluted EPS before Extra 146 147 Accounts Receivable 148 Inventory 149 Net PPSE 150 Total Assets 151 152 Tangible Book Value 153 Common Equity 154 Cash from Ops. 155 Capital Expenditures 156 Levered Free Cash Flow 157 Unlevered Free Cash Flow 158 Dividend per Share 1.8% (1.6%) (3.9%) (6.5%) (6.4%) (13.7%) (13.8%) (7.6%) (12.7%) (0.4%) (0.7%) 4.6% 4.0% 3.9% (4.1%) (4.2%) 1.3% (3.7%) (2.0%) (2.6% 1.2% 1.3% 1.2% 5.5% 5.5% 5.7% 6.0% (1.7%) (5.3%) (8.2%) (9.6%) (9.7%) (5.8%) (5.9%) (10.7%) (5.0%) (1.4%) (3.3%) 3.1% 4.6% 4.4% 9.1% 8.7% 5.3% 9.9% 5.6% 3.4% 3.0% 5.2% 2.2% 1.1% 1.7% 4.8% 1.0% (2.3%) (0.4%) 1.5% (1.2%) 1.3% (0.7%) 2.8% 3.6% (0.8%) 2.0% 3.0% SE DESSEEEE NM (0.3%) 10.9% 3.1% 6.4% 5.2% 4.9% NM 1.2% (4.4%) (3.1%) 19.1% 17.8% 4.1% NM (2.0%) (25.5%) (1.2%) 10.8% 9.1% 4.0% NM (6.0%) (3.2%) (1.9%) (12.3%) (10.7%) 4.1% NM (0.3%) (8.1%) 0.1% (3.9%) (2.4%) 3.5% 159 160 1611 Ratios Ready E @ J- - + 100%Step by Step Solution
There are 3 Steps involved in it
1 Expert Approved Answer
Step: 1 Unlock

Question Has Been Solved by an Expert!
Get step-by-step solutions from verified subject matter experts
Step: 2 Unlock
Step: 3 Unlock