

Question: using statistics and probability My = 3.96 1 x2 = 3.4 My = 4. 16 6. Looking at the three sample means in R (how
using statistics and probability
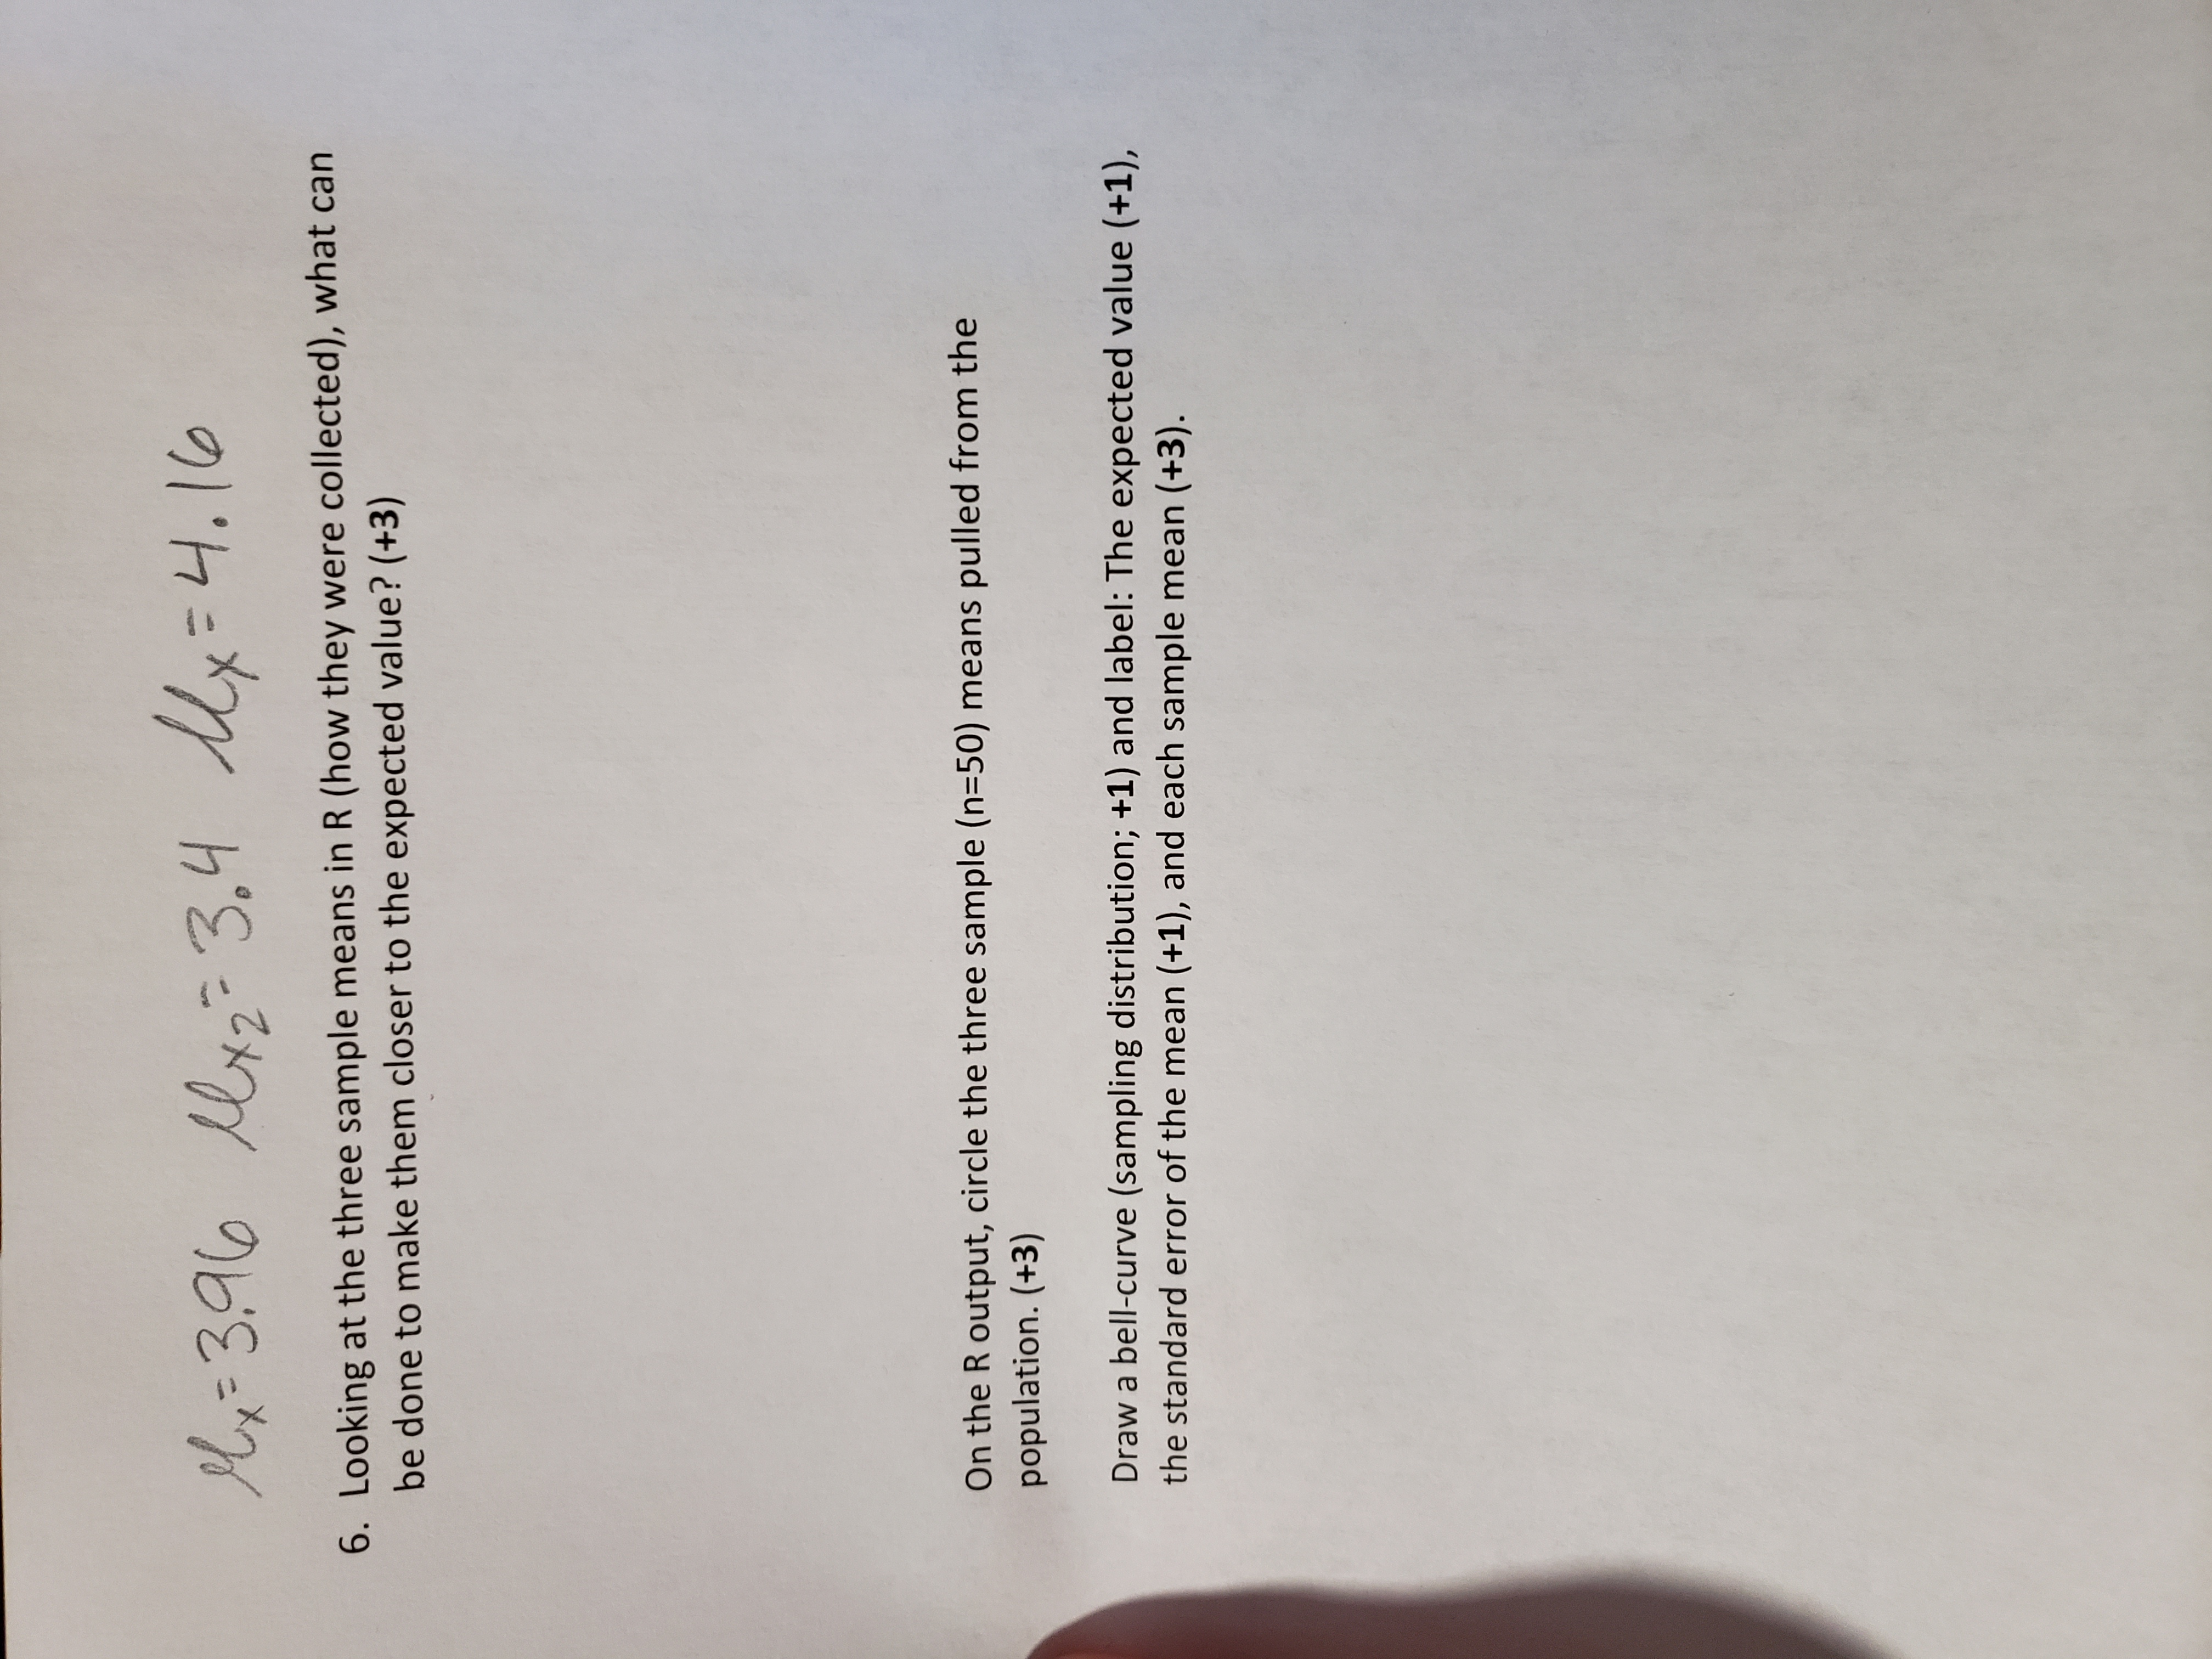
My = 3.96 1 x2 = 3.4 My = 4. 16 6. Looking at the three sample means in R (how they were collected), what can be done to make them closer to the expected value? (+3) On the R output, circle the three sample (n=50) means pulled from the population. (+3) Draw a bell-curve (sampling distribution; +1) and label: The expected value (+1), the standard error of the mean (+1), and each sample mean (+3)
Step by Step Solution
There are 3 Steps involved in it
1 Expert Approved Answer
Step: 1 Unlock

Question Has Been Solved by an Expert!
Get step-by-step solutions from verified subject matter experts
Step: 2 Unlock
Step: 3 Unlock