Question: Using statistics to support expansion plans evaluate the data from the Agency for Healthcare Research and Quality (AHRQ) Data and Surveys (www.ahrq.gov/data) shown in Figure
Using statistics to support expansion plans evaluate the data from the Agency for Healthcare Research and Quality (AHRQ) Data and Surveys (www.ahrq.gov/data) shown in Figure 2-8 ?. After reading the statistics (in the next paragraph) and refer-encing Figure 2-8, determine what services you would recom-mend if you were the administrator of a health care facility in illinois, to expand what is available at your facility. Support your recommendation with specific statistics from the table.
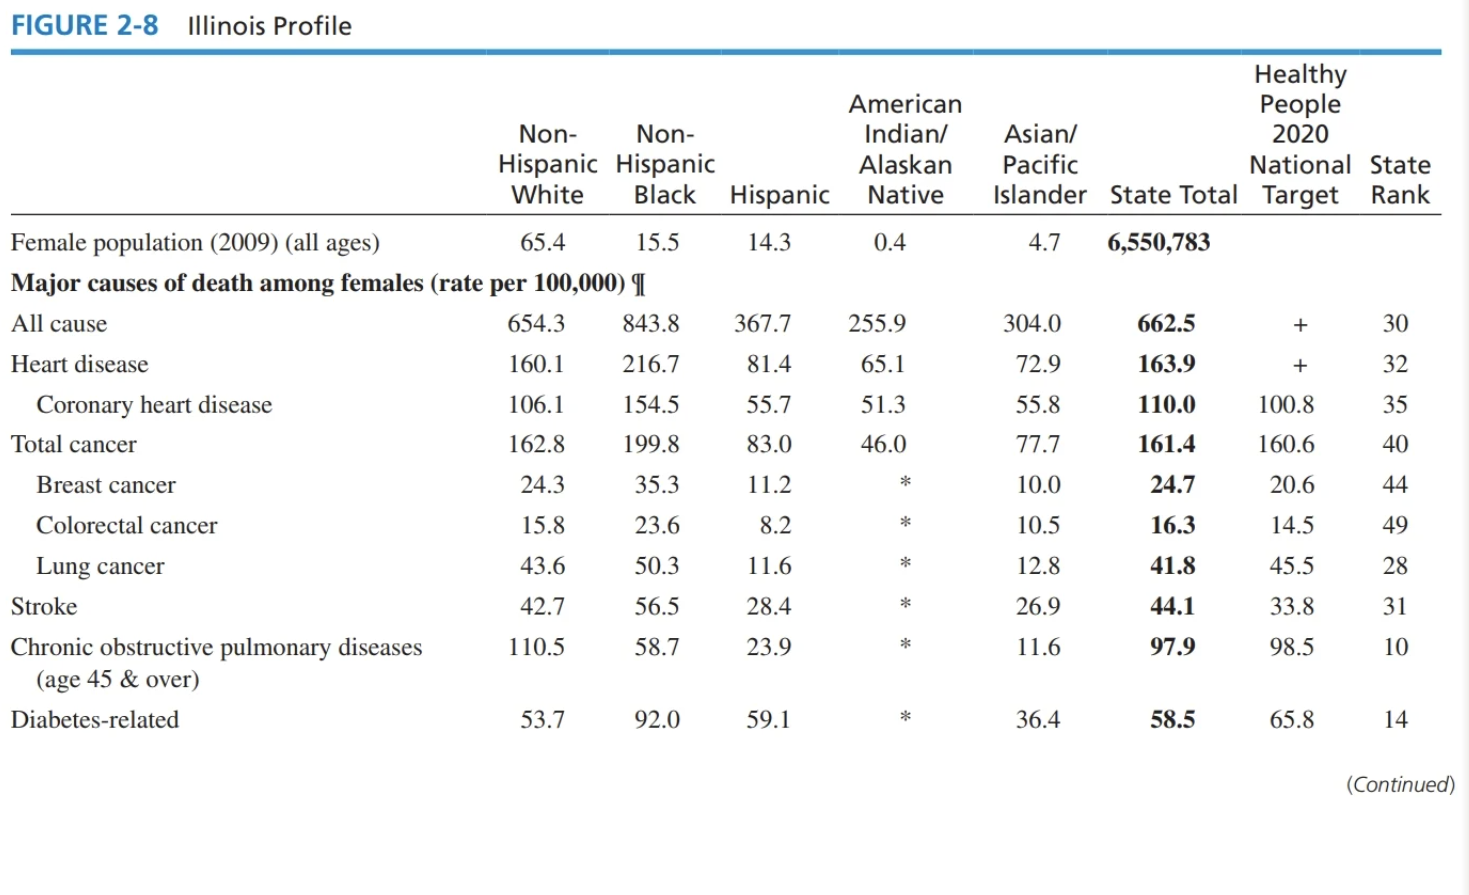
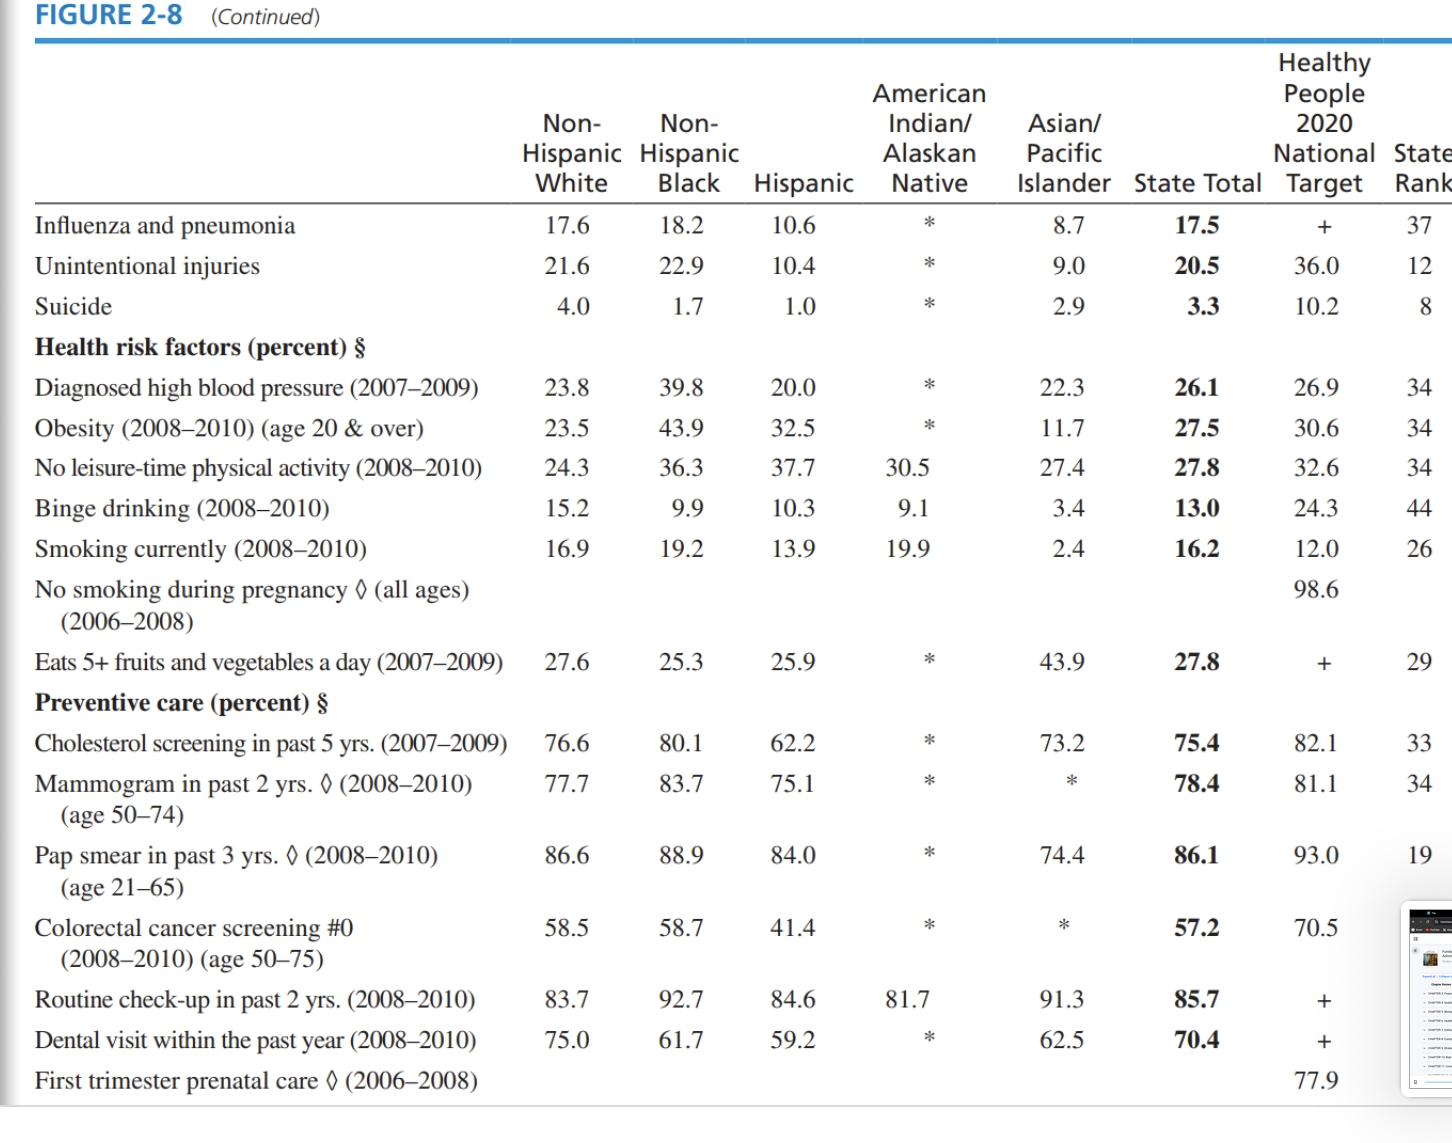
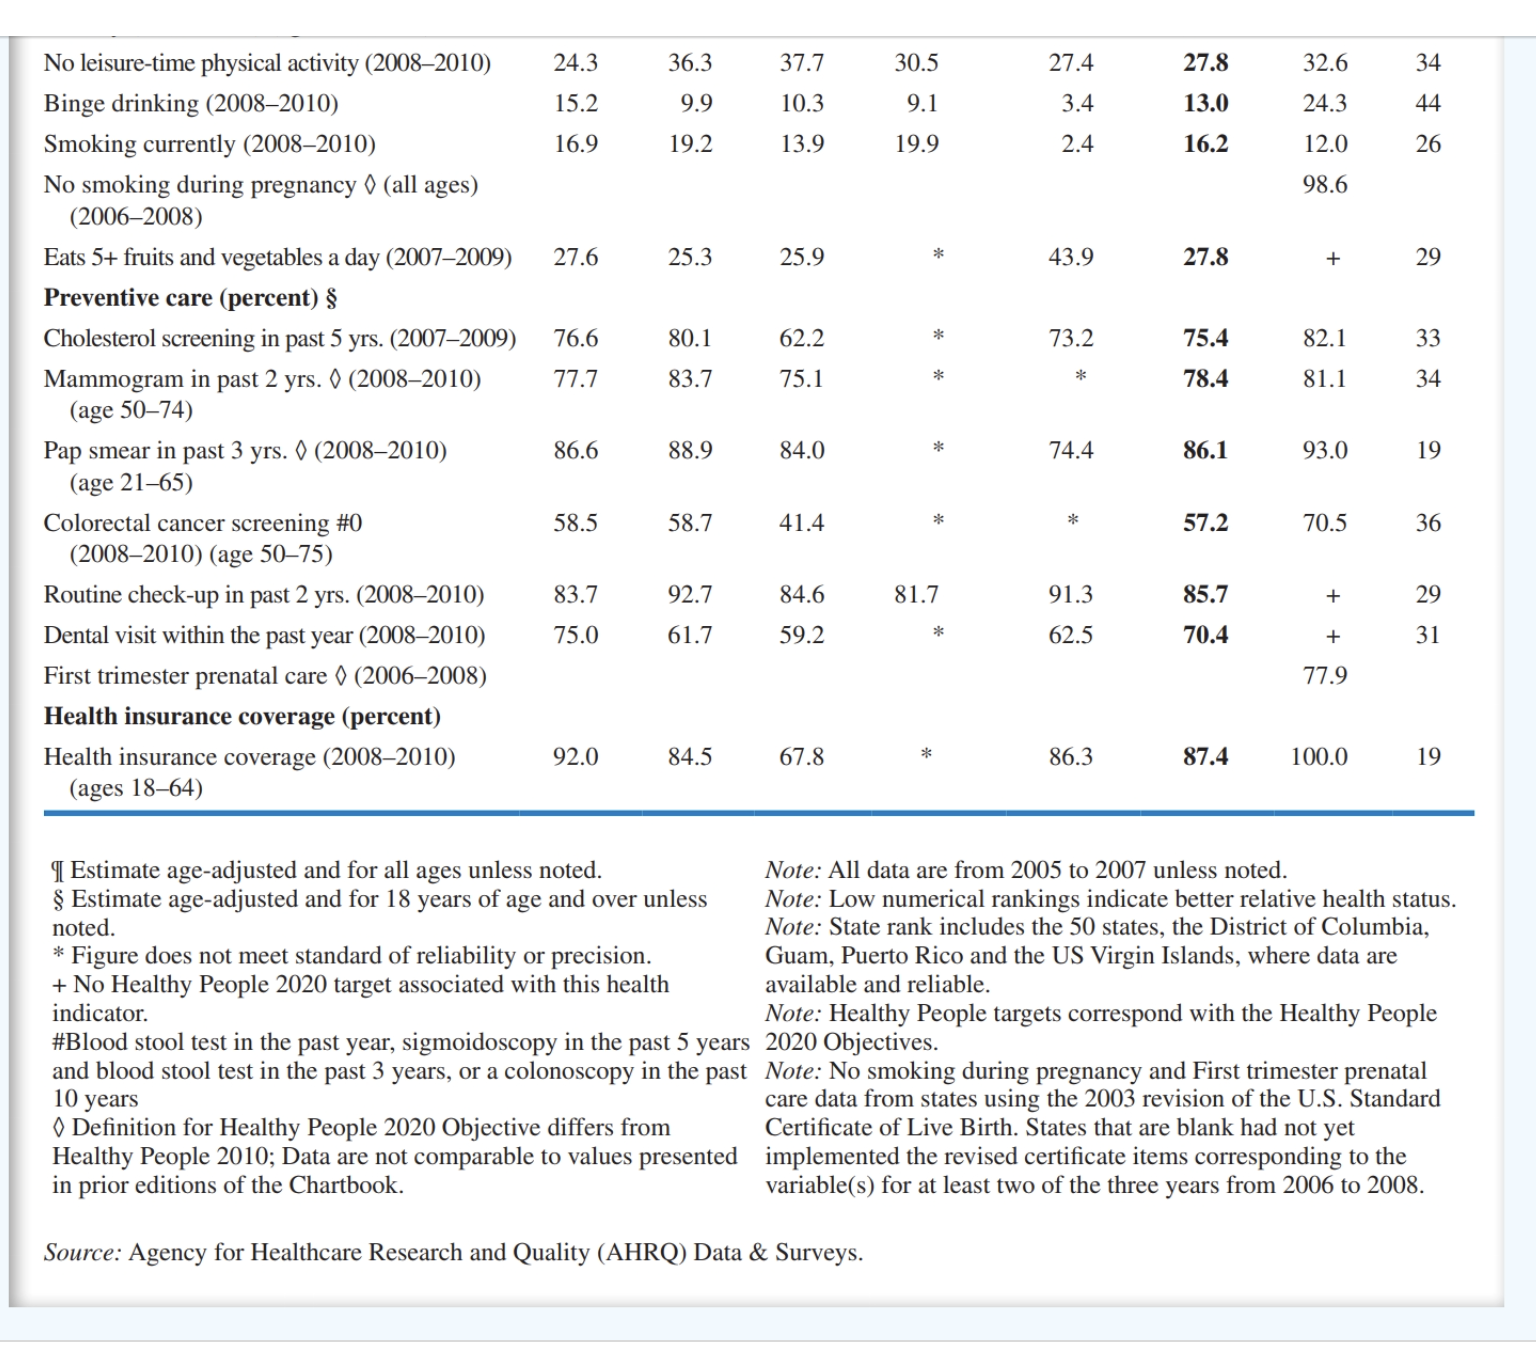
Illinois Profile Of the state's 6.5 million women, nearly two thirds are non-Hispanic White. Its largest minority populations are non-Hispanic Black, at 16 percent, and Hispanic, at 14 percent. It ranks in the top 15 states in its low rates of death for suicide, unintentional injuries, diabetes-related causes and chronic obstructive pulmonary diseases. It has a much poorer record in rates of death for breast cancer, coronary heart disease, influenza and pneumonia, and colorectal cancer. Not surprisingly, it ranks among the worst states in the percentage of women who have had recent colorectal cancer screening. Illinois ranks in the middle of the nation in cholesterol screening, mammograms, and Pap smears. Eighty-seven percent of its women have health insurance, with Hispanic women having the lowest rate of insurance coverage, at 68 percent.
FIGURE 2-8 Illinois Profile Healthy American People Non- Non- Indian/ Asian/ 2020 Hispanic Hispanic Alaskan Pacific National State White Black Hispanic Native Islander State Total Target Rank Female population (2009) (all ages) 65.4 15.5 14.3 0.4 4.7 6,550,783 Major causes of death among females (rate per 100,000) 9 All cause 654.3 843.8 367.7 255.9 304.0 662.5 + 30 Heart disease 160.1 216.7 81.4 65.1 72.9 163.9 + 32 Coronary heart disease 106.1 154.5 55.7 51.3 55.8 110.0 100.8 35 Total cancer 162.8 199.8 83.0 46.0 77.7 161.4 160.6 40 Breast cancer 24.3 35.3 11.2 10.0 24.7 20.6 44 Colorectal cancer 15.8 23.6 8.2 10.5 16.3 14.5 49 Lung cancer 43.6 50.3 11.6 12.8 41.8 45.5 28 Stroke 42.7 56.5 28.4 26.9 44.1 33.8 31 Chronic obstructive pulmonary diseases 110.5 58.7 23.9 11.6 97.9 98.5 10 (age 45 & over) Diabetes-related 53.7 92.0 59.1 36.4 58.5 65.8 14 (Continued)FIGURE 2-8 (Continued) Healthy American People Non- Non- Indian/ Asian/ 2020 Hispanic Hispanic Alaskan Pacific National State White Black Hispanic Native Islander State Total Target Ran Influenza and pneumonia 17.6 18.2 10.6 8.7 17.5 + 37 Unintentional injuries 21.6 22.9 10.4 9.0 20.5 36.0 12 Suicide 4.0 1.7 1.0 2.9 3.3 10.2 8 Health risk factors (percent) $ Diagnosed high blood pressure (2007-2009) 23.8 39.8 20.0 * 22.3 26.1 26.9 34 Obesity (2008-2010) (age 20 & over) 23.5 43.9 32.5 11.7 27.5 30.6 34 No leisure-time physical activity (2008-2010) 24.3 36.3 37.7 30.5 27.4 27.8 32.6 34 Binge drinking (2008-2010) 15.2 9.9 10.3 9.1 3.4 13.0 24.3 44 Smoking currently (2008-2010) 16.9 19.2 13.9 19.9 2.4 16.2 12.0 26 No smoking during pregnancy (all ages) 98.6 (2006-2008) Eats 5+ fruits and vegetables a day (2007-2009) 27.6 25.3 25.9 43.9 27.8 + 29 Preventive care (percent) $ Cholesterol screening in past 5 yrs. (2007-2009) 76.6 80.1 62.2 73.2 75.4 82.1 33 Mammogram in past 2 yrs. (2008-2010) 77.7 83.7 75.1 78.4 81.1 34 (age 50-74) Pap smear in past 3 yrs. (2008-2010) 86.6 88.9 84.0 74.4 86.1 93.0 19 (age 21-65) Colorectal cancer screening #0 58.5 58.7 41.4 * 57.2 70.5 (2008-2010) (age 50-75) Routine check-up in past 2 yrs. (2008-2010) 83.7 92.7 84.6 81.7 91.3 85.7 + Dental visit within the past year (2008-2010) 75.0 61.7 59.2 62.5 70.4 + First trimester prenatal care (2006-2008) 77.9No leisure-time physical activity (2008-2010) 24.3 36.3 37.7 30.5 274 27.8 32.6 34 Binge drinking (2008-2010) 15.2 9.9 10.3 9.1 34 13.0 24.3 - Smoking currently (2008-2010) 16.9 19.2 13.9 19.9 2.4 16.2 12.0 26 No smoking during pregnancy (all ages) 98.6 (2006-2008) Eats 5+ fruits and vegetables a day (2007-2009) 27.6 253 259 % 439 27.8 + 29 Preventive care (percent) Cholesterol screening in past 5 yrs. (2007-2009) 76.6 80.1 62.2 * 732 75.4 82.1 33 Mammogram in past 2 yrs. { (2008-2010) 71.7 83.7 151 * * 78.4 81.1 34 (age 50-74) Pap smear in past 3 yrs. { (2008-2010) 86.6 88.9 84.0 * 74.4 86.1 93.0 19 (age 21-65) Colorectal cancer screening #0 58.5 58.7 414 * * 57.2 70.5 36 (2008-2010) (age 50-75) Routine check-up in past 2 yrs. (2008-2010) 83.7 92.7 84.6 81.7 91.3 85.7 + 29 Dental visit within the past year (2008-2010) 75.0 61.7 59.2 * 62.5 70.4 + 31 First trimester prenatal care (2006-2008) 77.9 Health insurance coverage (percent) Health insurance coverage (2008-2010) 92.0 84.5 67.8 * 86.3 87.4 100.0 19 (ages 18-64) I Estimate age-adjusted and for all ages unless noted. Note: All data are from 2005 to 2007 unless noted. Estimate age-adjusted and for 18 years of age and over unless Note: Low numerical rankings indicate better relative health status. noted. Note: State rank includes the 50 states, the District of Columbia, * Figure does not meet standard of reliability or precision. Guam, Puerto Rico and the US Virgin Islands, where data are + No Healthy People 2020 target associated with this health available and reliable. indicator. Note: Healthy People targets correspond with the Healthy People #Blood stool test in the past year, sigmoidoscopy in the past 5 years 2020 Objectives. and blood stool test in the past 3 years, or a colonoscopy in the past Note: No smoking during pregnancy and First trimester prenatal 10 years care data from states using the 2003 revision of the U.S. Standard O Definition for Healthy People 2020 Objective differs from Certificate of Live Birth. States that are blank had not yet Healthy People 2010; Data are not comparable to values presented implemented the revised certificate items corresponding to the in prior editions of the Chartbook. variable(s) for at least two of the three years from 2006 to 2008. Source: Agency for Healthcare Research and Quality (AHRQ) Data & Surveys
Step by Step Solution
There are 3 Steps involved in it
1 Expert Approved Answer
Step: 1 Unlock
Question Has Been Solved by an Expert!
Get step-by-step solutions from verified subject matter experts
Step: 2 Unlock
Step: 3 Unlock
Students Have Also Explored These Related Mathematics Questions!