

Question: Using swift: 1.Using xcode 9.3 create a GUI displaying a line graph y mx + b , where the user is able to shift the
Using swift:
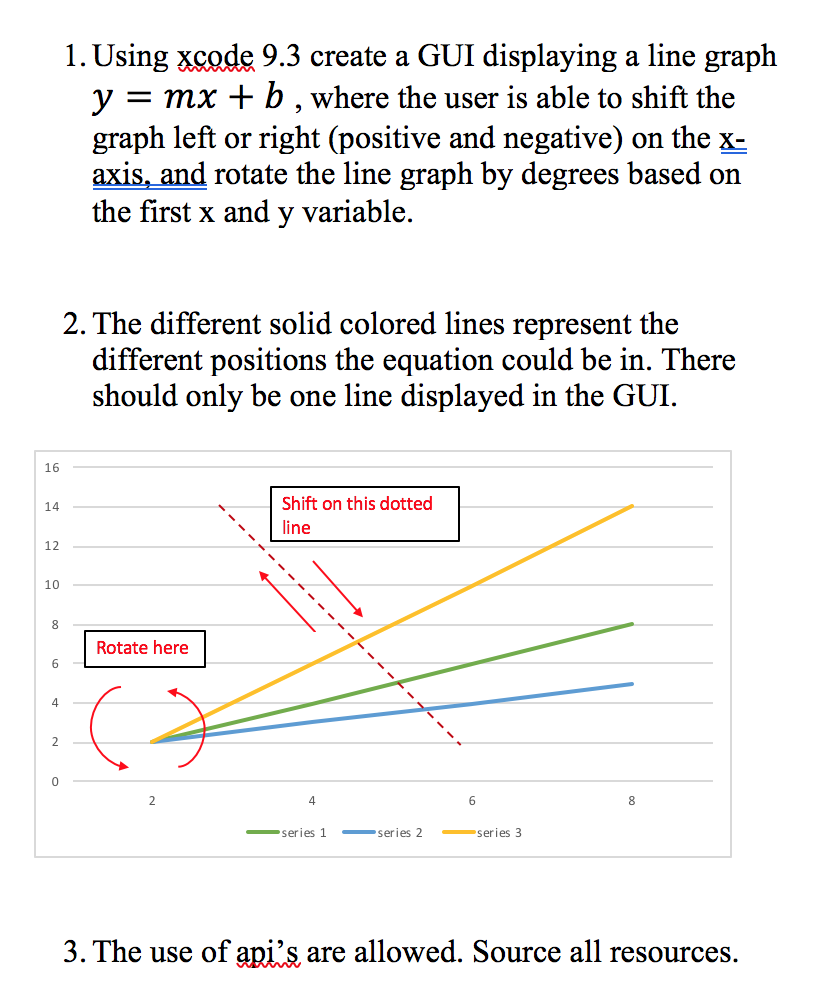
1.Using xcode 9.3 create a GUI displaying a line graph y mx + b , where the user is able to shift the graph left or right (positive and negative) on the x- axis,and rotate the line graph by degrees based on the first x and y variable. 2. The different solid colored lines represent the different positions the equation could be in. There should only be one line displayed in the GUI 16 Shift on this dotted ne 14 12 10 Rotate here 6 4 4 8 series 1 -series series 3 3.The use of api's are allowed. Source all resources 1.Using xcode 9.3 create a GUI displaying a line graph y mx + b , where the user is able to shift the graph left or right (positive and negative) on the x- axis,and rotate the line graph by degrees based on the first x and y variable. 2. The different solid colored lines represent the different positions the equation could be in. There should only be one line displayed in the GUI 16 Shift on this dotted ne 14 12 10 Rotate here 6 4 4 8 series 1 -series series 3 3.The use of api's are allowed. Source all resources
Step by Step Solution
There are 3 Steps involved in it

Get step-by-step solutions from verified subject matter experts