

Question: Using Table 1 answer the following questions: The data presented in Table 1 below show the price and quantity data collected for four (4) selected
Using Table 1 answer the following questions:
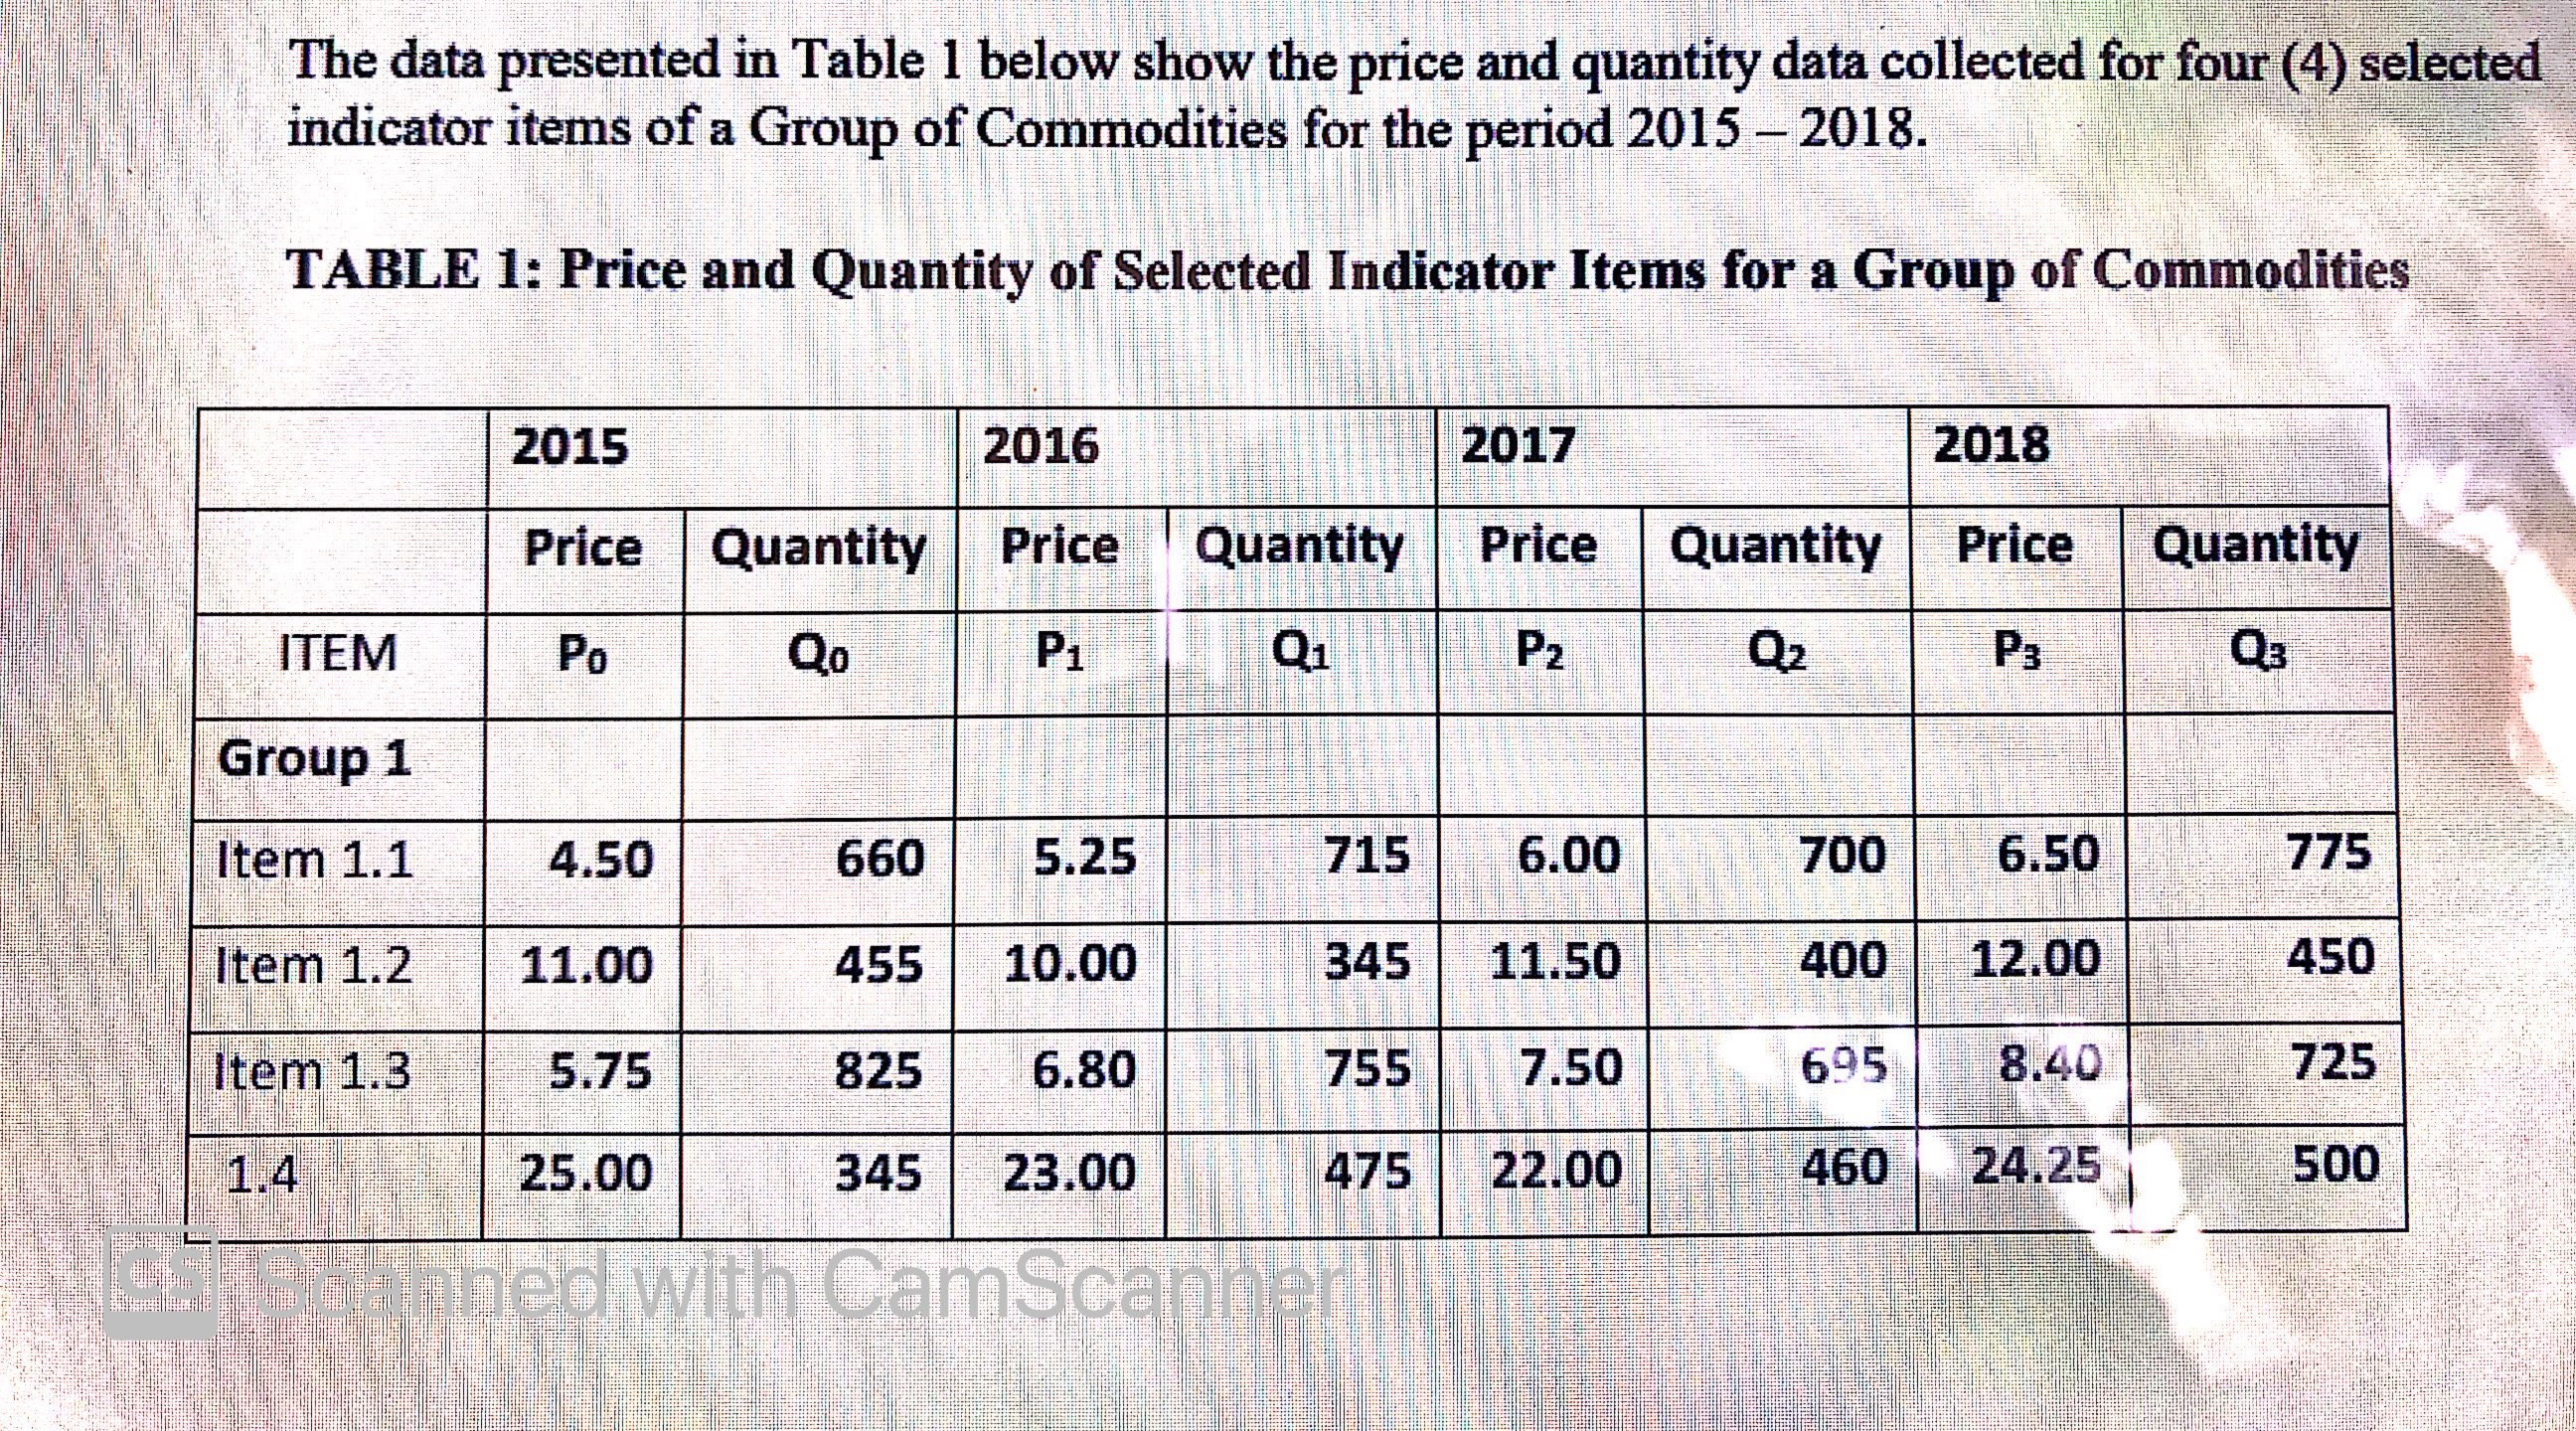
The data presented in Table 1 below show the price and quantity data collected for four (4) selected indicator items of a Group of Commodities for the period 2015 - 2018. TABLE 1: Price and Quantity of Selected Indicator Items for a Group of Commodities 2015 2016 2017 2018 Price Quantity Price Quantity Price Quantity Price Quantity ITEM Po Qo P1 Q1 P2 Q2 P3 Q3 Group 1 Item 1.1 4.50 660 5.25 715 6.00 700 6.50 775 Item 1.2 11.00 455 10.00 345 11.50 400 12.00 450 Item 1.3 5.75 825 6.80 755 7.50 695 8.40 725 1.4 25.00 345 23.00 475 22.00 460 24.25 500 ed with CamScant
Step by Step Solution
There are 3 Steps involved in it
1 Expert Approved Answer
Step: 1 Unlock

Question Has Been Solved by an Expert!
Get step-by-step solutions from verified subject matter experts
Step: 2 Unlock
Step: 3 Unlock