

Question: Using table 6.7 from the textbook, answer the following question. Table 6.7 Average annual return on stocks and 1-month T-bills; standard deviation and Sharpe ratio
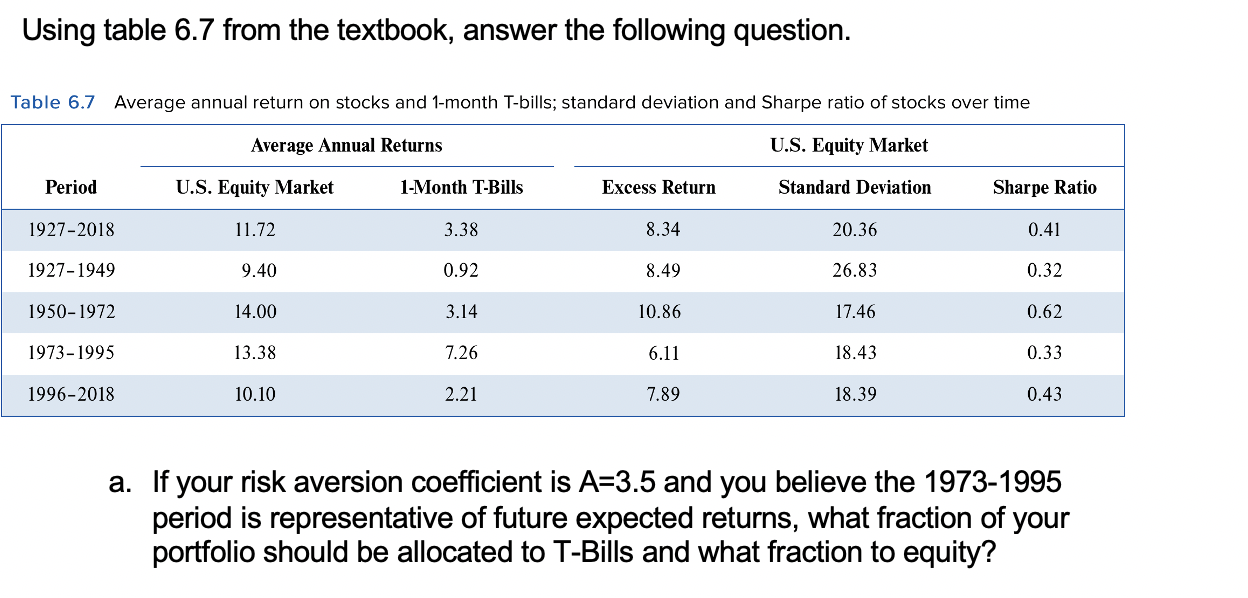
Using table 6.7 from the textbook, answer the following question. Table 6.7 Average annual return on stocks and 1-month T-bills; standard deviation and Sharpe ratio of stocks over time Average Annual Returns U.S. Equity Market Period U.S. Equity Market 1- Month T-Bills Excess Return Standard Deviation Sharpe Ratio 1927-2018 11.72 3.38 8.34 20.36 0.41 1927-1949 9.40 0.92 8.49 26.83 0.32 1950-1972 14.00 3.14 10.86 17.46 0.62 1973-1995 13.38 7.26 6.11 18.43 0.33 1996-2018 10.10 2.21 7.89 18.39 0.43 a. If your risk aversion coefficient is A=3.5 and you believe the 1973-1995 period is representative of future expected returns, what fraction of your portfolio should be allocated to T-Bills and what fraction to equity
Step by Step Solution
There are 3 Steps involved in it

Get step-by-step solutions from verified subject matter experts