

Question: Using table Q4c below, draw an network diagram, calculate float for each task using earliest and latest event times and determine the following: i)Total
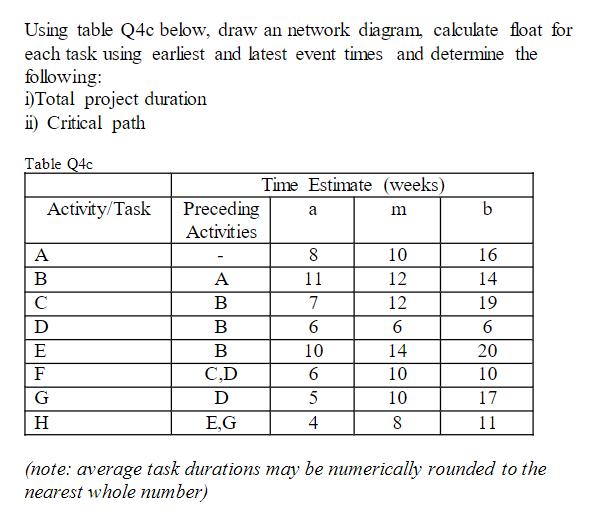
Using table Q4c below, draw an network diagram, calculate float for each task using earliest and latest event times and determine the following: i)Total project duration ii) Critical path Table Q4c Activity/Task A BCDEF C D G H Preceding Activities A B B B C,D D E,G Time Estimate (weeks) m a 8 11 7 6 10 6 5 4 10 12 12 6 14 10 10 8 b 16 14 19 6 20 10 17 11 (note: average task durations may be numerically rounded to the nearest whole number)
Step by Step Solution
3.46 Rating (156 Votes )
There are 3 Steps involved in it
Based on the given data we first find the expected duration and variance for each activity as shown ... View full answer

Get step-by-step solutions from verified subject matter experts