

Question: using tableau, answer all the questions above with explanations. a step-by-step approach Exercise 1 A. You are to explore the global Covid-19 vaccination program (data
using tableau, answer all the questions above with explanations. a step-by-step approach
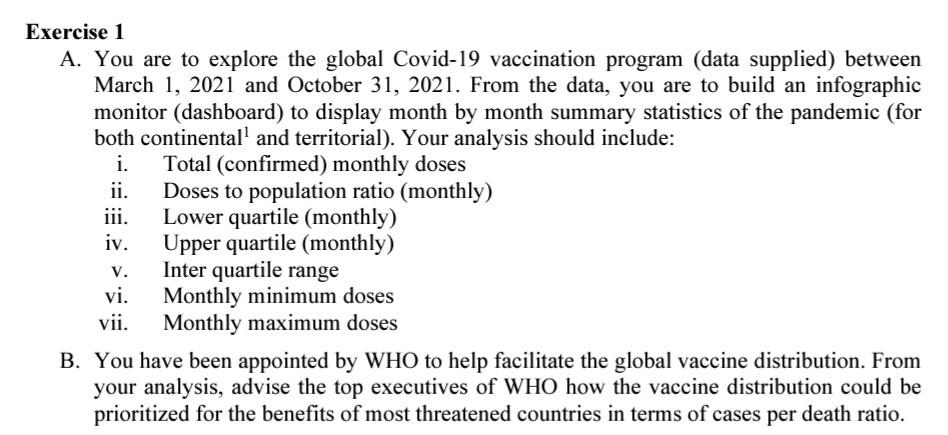
Exercise 1 A. You are to explore the global Covid-19 vaccination program (data supplied) between March 1, 2021 and October 31, 2021. From the data, you are to build an infographic monitor (dashboard) to display month by month summary statistics of the pandemic (for both continentall and territorial). Your analysis should include: i. Total (confirmed) monthly doses ii. Doses to population ratio (monthly) iii. Lower quartile (monthly) iv. Upper quartile (monthly) Inter quartile range vi. Monthly minimum doses vii. Monthly maximum doses B. You have been appointed by WHO to help facilitate the global vaccine distribution. From your analysis, advise the top executives of WHO how the vaccine distribution could be prioritized for the benefits of most threatened countries in terms of cases per death ratio. V. Exercise 1 A. You are to explore the global Covid-19 vaccination program (data supplied) between March 1, 2021 and October 31, 2021. From the data, you are to build an infographic monitor (dashboard) to display month by month summary statistics of the pandemic (for both continentall and territorial). Your analysis should include: i. Total (confirmed) monthly doses ii. Doses to population ratio (monthly) iii. Lower quartile (monthly) iv. Upper quartile (monthly) Inter quartile range vi. Monthly minimum doses vii. Monthly maximum doses B. You have been appointed by WHO to help facilitate the global vaccine distribution. From your analysis, advise the top executives of WHO how the vaccine distribution could be prioritized for the benefits of most threatened countries in terms of cases per death ratio. V
Step by Step Solution
There are 3 Steps involved in it

Get step-by-step solutions from verified subject matter experts