

Question: Using the 2016 & 2017 financial statements for both stocks, prepare two financial ratios for each of the following categories: liquidity ratios, asset management ratios,
 Using the 2016 & 2017 financial statements for both stocks, prepare two financial ratios for each of the following categories: liquidity ratios, asset management ratios, and profitability ratios. You should have a total of six ratios for each stock, per year. What challenges, strengths, or weaknesses do you see? Please be articulate. Home Depot and Amazon.com
Amazon.com Annual Balance Sheet
Quarterly Balance Sheet
All numbers in thousands
| Period Ending | 12/31/2017 | 12/31/2016 | 12/31/2015 | 12/31/2014 |
| Current Assets | ||||
| Cash And Cash Equivalents | 20,522,000 | 19,334,000 | 15,890,000 | 14,557,000 |
| Short Term Investments | 10,464,000 | 6,647,000 | 3,918,000 | 2,859,000 |
| Net Receivables | 13,164,000 | 8,339,000 | 5,654,000 | 5,612,000 |
| Inventory | 16,047,000 | 11,461,000 | 10,243,000 | 8,299,000 |
| Other Current Assets | - | - | - | - |
| Total Current Assets | 60,197,000 | 45,781,000 | 35,705,000 | 31,327,000 |
| Long Term Investments | 441,000 | 223,000 | 16,000 | - |
| Property Plant and Equipment | 48,866,000 | 29,114,000 | 21,838,000 | 16,967,000 |
| Goodwill | 13,350,000 | 3,784,000 | 3,759,000 | 3,319,000 |
| Intangible Assets | 3,371,000 | 854,000 | 992,000 | 764,000 |
| Accumulated Amortization | - | - | - | - |
| Other Assets | 5,085,000 | 3,646,000 | 2,437,000 | 2,128,000 |
| Deferred Long Term Asset Charges | - | - | - | - |
| Total Assets | 131,310,000 | 83,402,000 | 64,747,000 | 54,505,000 |
| Current Liabilities | ||||
| Accounts Payable | 34,616,000 | 25,309,000 | 20,397,000 | 16,459,000 |
| Short/Current Long Term Debt | 100,000 | 1,056,000 | 238,000 | 1,520,000 |
| Other Current Liabilities | 8,097,000 | 7,168,000 | 5,118,000 | 3,523,000 |
| Total Current Liabilities | 57,883,000 | 43,816,000 | 33,887,000 | 28,089,000 |
| Long Term Debt | 24,743,000 | 7,694,000 | 8,227,000 | 8,265,000 |
| Other Liabilities | 7,792,000 | 5,088,000 | 3,301,000 | 3,186,000 |
| Deferred Long Term Liability Charges | - | - | - | - |
| Minority Interest | - | - | - | - |
| Negative Goodwill | - | - | - | - |
| Total Liabilities | 103,601,000 | 64,117,000 | 51,363,000 | 43,764,000 |
| Stockholders' Equity | ||||
| Misc. Stocks Options Warrants | - | - | - | - |
| Redeemable Preferred Stock | - | - | - | - |
| Preferred Stock | - | - | - | - |
| Common Stock | 5,000 | 5,000 | 5,000 | 5,000 |
| Retained Earnings | 8,636,000 | 4,916,000 | 2,545,000 | 1,949,000 |
| Treasury Stock | -2,321,000 | -2,822,000 | -2,560,000 | -2,348,000 |
| Capital Surplus | 21,389,000 | 17,186,000 | 13,394,000 | 11,135,000 |
| Other Stockholder Equity | -484,000 | -985,000 | -723,000 | -511,000 |
| Total Stockholder Equity | 27,709,000 | 19,285,000 | 13,384,000 | 10,741,000 |
| Net Tangible Assets | 10,988,000 | 14,647,000 | 8,633,000 | 6,658,000 |
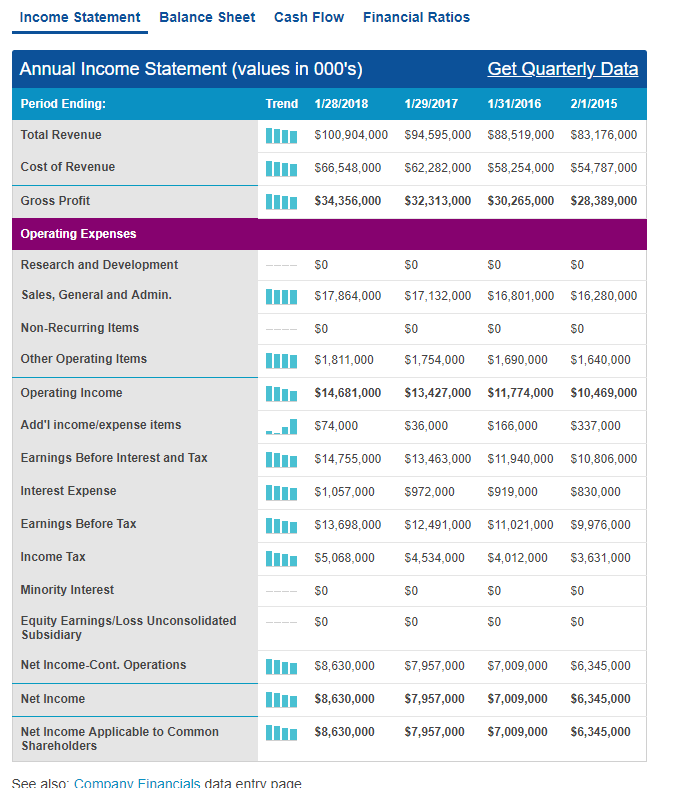
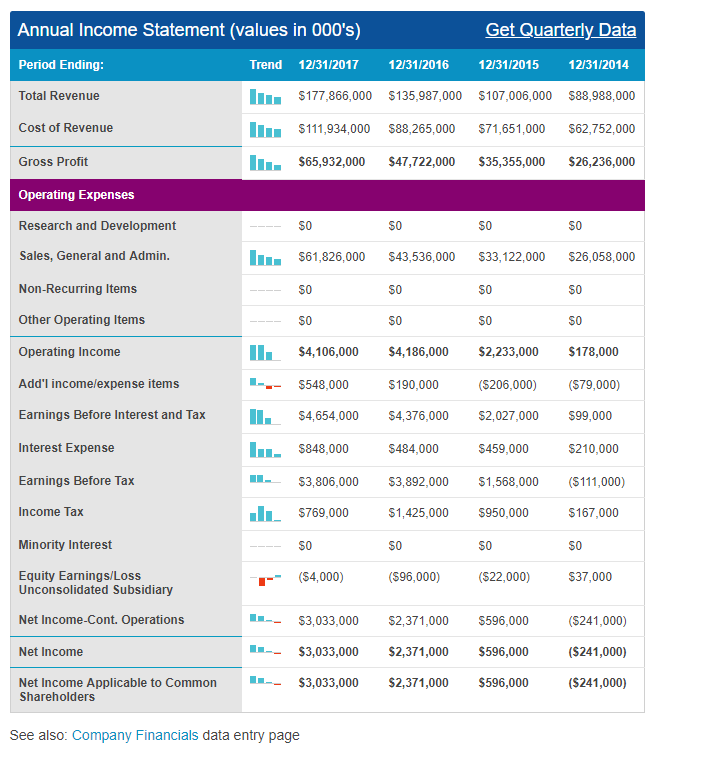
Income Statement Balance Sheet Cash Flow Financial Ratios Annual Income Statement (values in 000's) Period Ending Total Revenue Get Quarterly Data Trend 1/28/2018 1/29/2017 /3 1/31/2016 2/1/2015 $100,904,000 $94,595,000 $88,519,000 $83,176,000 $66,548,000 $62,282,000 $58,254,000 $54,787,000 S34,356,000 $32,313,000 S30,265,000 $28,389,000 Cost of Revenue Gross Profit Operating Expenses Research and Development Sales, General and Admin Non-Recurring Items Other Operating Items Operating Income Add'l income/expense items Earnings Before Interest and Tax Interest Expense S0 $17,864,000 $17,132,000 $16,801,000 $16,280,000 S0 $1,811,000 $1,754,000 $1,690,000 $1,640,000 $14,681,000 $13,427,000 $11,774,000 $10,469,000 S0 S0 S0 S0 S0 S0 $74,000 36,000 166,000 337,000 $14,755,000 $13,463,000 $11,940,000 $10,806,000 $1,057,000 $972,000 $919,000 $830,000 $13,698,000 $12,491,000 $11,021,000 $9,976,000 $5,068,000 $4,534,000 $4,012,000 $3,631,000 Earnings Before Tax Income Tax Minority Interest S0 S0 S0 S0 Equity Earnings/Loss Unconsolidated Subsidiary S0 S0 S0 S0 Net Income-Cont. Operations $8,630,000 $7,957,000 $7,009,000 $6,345,000 $8,630,000 $7,957,000 $7,009,000 $6,345,000 $8,630,000 $7,957,000 $7,009,000 $6,345,000 Net Income Net Income Applicable to Common Shareholders See also Comnany Financials data entry nage Annual Income Statement (values in 000's) Period Ending Total Revenue Get Quarterly Data Trend 12/31/2017 12/31/2016 12/31/2015 12/31/2014 $177,866,000 $135,987,000 $107,006,000 $88,988,000 $111,934,000 $88,265,000 $71,651,000 S62,752,000 $65,932,000 $47,722,000 S35,355,000 $26,236,000 Cost of Revenue Gross Profit Operating Expenses Research and Development Sales, General and Admin. Non-Recurring Items Other Operating Items Operating Income Add'l income/expense items Earnings Before Interest and Tax Interest Expense S0 S0 S0 S0 $61,826,000 $43,536,000 $33,122,000 $26,058,000 S0 S0 S0 S0 S0 $4,106,000 $4,186,000 S2,233,000 $178,000 $548,000 $4,654,000 $848,000 S484 S0 S0 S0 190,000 ($206,000) (79,000) I 4,376,000 $2,027,000 $99,000 $484,000 S210,000 $3,806,000 3,892,000 $1,568,000 ($111,000) $769,000 $1,425,000 950,000 167,000 S459,000 Earnings Before Tax Income Tax Minority Interest S0 S0 S0 S0 Equity Earnings/Loss ($96,000) $3,033,000 $2,371,000 S596,000 S3,033,000 S2,371,000 S596,000 ($4,000) ($22,000) $37,000 Unconsolidated Subsidiary Net Income-Cont. Operations Net Income Net Income Applicable to CommonS3,033,000 $2,371,000 S596,000 ($241,000) ($241,000) ($241,000) Shareholders See also: Company Financials data entry page Income Statement Balance Sheet Cash Flow Financial Ratios Annual Income Statement (values in 000's) Period Ending Total Revenue Get Quarterly Data Trend 1/28/2018 1/29/2017 /3 1/31/2016 2/1/2015 $100,904,000 $94,595,000 $88,519,000 $83,176,000 $66,548,000 $62,282,000 $58,254,000 $54,787,000 S34,356,000 $32,313,000 S30,265,000 $28,389,000 Cost of Revenue Gross Profit Operating Expenses Research and Development Sales, General and Admin Non-Recurring Items Other Operating Items Operating Income Add'l income/expense items Earnings Before Interest and Tax Interest Expense S0 $17,864,000 $17,132,000 $16,801,000 $16,280,000 S0 $1,811,000 $1,754,000 $1,690,000 $1,640,000 $14,681,000 $13,427,000 $11,774,000 $10,469,000 S0 S0 S0 S0 S0 S0 $74,000 36,000 166,000 337,000 $14,755,000 $13,463,000 $11,940,000 $10,806,000 $1,057,000 $972,000 $919,000 $830,000 $13,698,000 $12,491,000 $11,021,000 $9,976,000 $5,068,000 $4,534,000 $4,012,000 $3,631,000 Earnings Before Tax Income Tax Minority Interest S0 S0 S0 S0 Equity Earnings/Loss Unconsolidated Subsidiary S0 S0 S0 S0 Net Income-Cont. Operations $8,630,000 $7,957,000 $7,009,000 $6,345,000 $8,630,000 $7,957,000 $7,009,000 $6,345,000 $8,630,000 $7,957,000 $7,009,000 $6,345,000 Net Income Net Income Applicable to Common Shareholders See also Comnany Financials data entry nage Annual Income Statement (values in 000's) Period Ending Total Revenue Get Quarterly Data Trend 12/31/2017 12/31/2016 12/31/2015 12/31/2014 $177,866,000 $135,987,000 $107,006,000 $88,988,000 $111,934,000 $88,265,000 $71,651,000 S62,752,000 $65,932,000 $47,722,000 S35,355,000 $26,236,000 Cost of Revenue Gross Profit Operating Expenses Research and Development Sales, General and Admin. Non-Recurring Items Other Operating Items Operating Income Add'l income/expense items Earnings Before Interest and Tax Interest Expense S0 S0 S0 S0 $61,826,000 $43,536,000 $33,122,000 $26,058,000 S0 S0 S0 S0 S0 $4,106,000 $4,186,000 S2,233,000 $178,000 $548,000 $4,654,000 $848,000 S484 S0 S0 S0 190,000 ($206,000) (79,000) I 4,376,000 $2,027,000 $99,000 $484,000 S210,000 $3,806,000 3,892,000 $1,568,000 ($111,000) $769,000 $1,425,000 950,000 167,000 S459,000 Earnings Before Tax Income Tax Minority Interest S0 S0 S0 S0 Equity Earnings/Loss ($96,000) $3,033,000 $2,371,000 S596,000 S3,033,000 S2,371,000 S596,000 ($4,000) ($22,000) $37,000 Unconsolidated Subsidiary Net Income-Cont. Operations Net Income Net Income Applicable to CommonS3,033,000 $2,371,000 S596,000 ($241,000) ($241,000) ($241,000) Shareholders See also: Company Financials data entry page
Step by Step Solution
There are 3 Steps involved in it

Get step-by-step solutions from verified subject matter experts