

Question: Using the 8 non-shaded values above, find a_0 and a_1 for the least squares linear regression. We will save the shaded values for our test
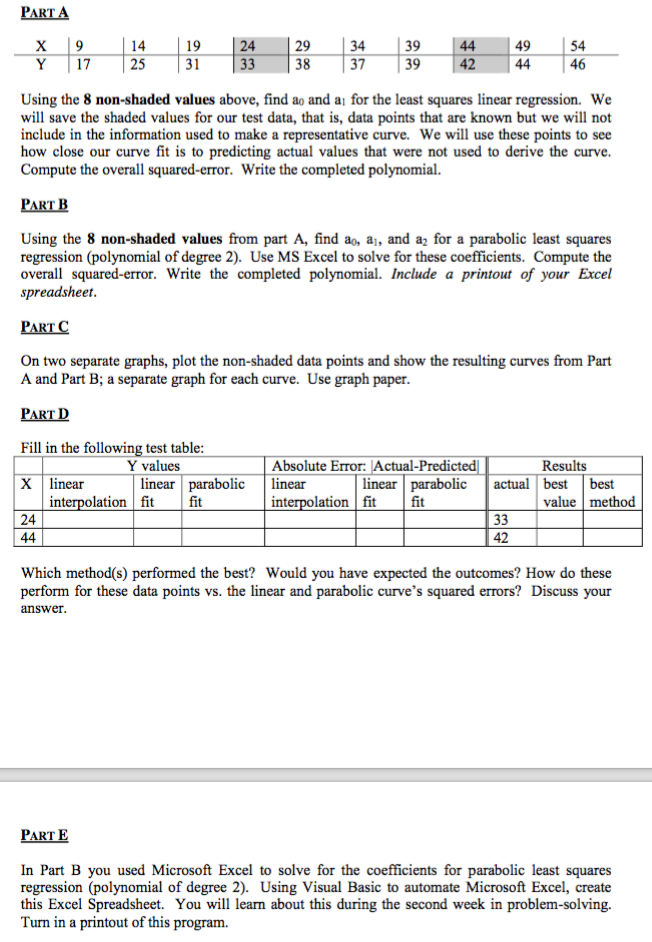
Using the 8 non-shaded values above, find a_0 and a_1 for the least squares linear regression. We will save the shaded values for our test data, that is, data points that are known but we will not include in the information used to make a representative curve. We will use these points to sec how close our curve fit is to predicting actual values that were not used to derive the curve. Compute the overall squared-error. Write the completed polynomial. Using the 8 non-shaded values from part A, find a_0, a_1, and a_2 for a parabolic least squares regression (polynomial of degree 2). Use MS Excel to solve for these coefficients. Compute the overall squared-error. Write the completed polynomial. Include a printout of your Excel spreadsheet. On two separate graphs, plot the non-shaded data points and show the resulting curves from Part A and Part B; a separate graph for each curve. Use graph paper. Fill in the following test table: which method(s) performed the best? Would you have expected the outcomes? How do these perform for these data points vs. the linear and parabolic curve's squared errors? Discuss your
Step by Step Solution
There are 3 Steps involved in it

Get step-by-step solutions from verified subject matter experts