

Question: Using the above data, run a linear regression of Dependent Variable: Milkwh Explanatory Variables: Pop, Pkwh, PGas, Income. Which coefficients (including the constant) are statistically
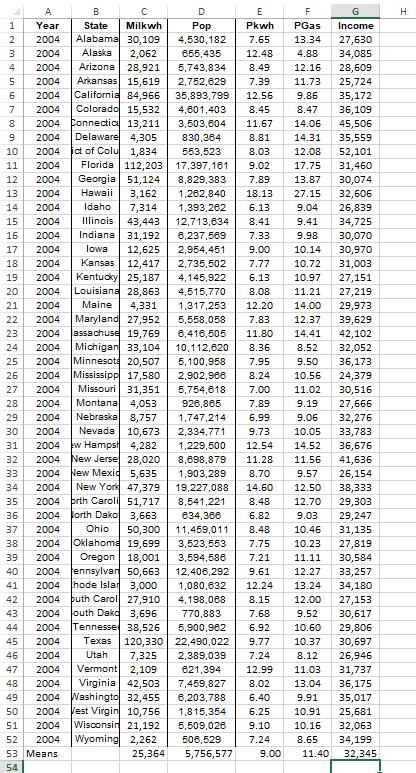 Using the above data, run a linear regression of Dependent Variable: Milkwh Explanatory Variables: Pop, Pkwh, PGas, Income. Which coefficients (including the constant) are statistically significant at the 10% level or better? Which are not significant? How much of the variation in the dependent variable is explained by the estimated equation? Is the equation as a whole statistically significant? At what level? 2. Run another regression like that in 1 above, but leave out the explanatory variables that were not significant at the 10% level or better. Are any coefficients not significant at the 10% level? How did the R-squared change from the regression in 1? How did the F statistic and its significance level change? In regression #2, are the signs (+ or -) of the estimated coefficients consistent with economic theory? Explain. (Hint: Is the demand curve downward sloping? Are the related goods complements or substitutes? Does an increase in population increase demand?) For regression #2, what are the inverse demand equation and the marginal revenue equation derived from the estimated demand equation? Write these out using numbers calculated from your regression output and the means of the variables listed below.
HEMAFEES 2 3 6 7 10 11 2004 Arizona 28,921 5,743,834 2004 Arkansas 15,619 2,752,629 8.45 2004 California 84,966 35,893,799 2004 Colorado 15,532 4,601,403 2004 Connectic 13,211 3,503,604 2004 Delaware 4,305 ict of Colu 1,834 11.67 8.81 14.31 830,364 553,523 2004 8.03 12.08 2004 17,397,161 9.02 17.75 2004 Florida 112,203 Georgia 51,124 Hawaii 3,162 8,829,383 7.89 13.87 2004 18.13 27.15 2004 Idaho 7,314 6.13 9.04 2004 Illinois 43,443 12,713,634 8.41 9.41 2004 Indiana 31,192 6,237,569 7.33 9.98 2004 2,954,451 9.00 10.14 lowa 12,625 Kansas 12,417 2004 2,735,502 7.77 10.72 4,145,922 6.13 10.97 19 2004 20 2004 Kentucky 25,187 Louisiana 28,863 4,515,770 8.08 11.21 27,219 21 1,317,253 12.20 14.00 29,973 2004 22 2004 7.83 12.37 39,629 11.80 14.41 42,102 8.52 32,052 Maine 4,331 Maryland 27,952 2004 assachuse 19,769 2004 Michigan 33,104 2004 Minnesota 20,507 2004 Mississipp 17,580 2004 Missouri 31,351 2004 Montana 4,053 5,558,058 6,416,505 10,112,620 8.36 5,100,958 7.95 2,902,968 8.24 5,754,618 7.00 11.02 9.50 36,173 10.56 24,379 30,516 7.89 9.19 27,666 926,865 1,747,214 6.99 9.06 32,276 10.05 33,783 2,334,771 9.73 1,229,500 8,698,879 12.54 14.52 36,676 11.28 11.56 41,636 8.70 9.57 26,154 12.50 38,333 1,903,289 19,227,088 14.60 8,541,221 8.48 634,366 11,459,011 8.48 12.70 29,303 6.82 9.03 29,247 10.46 31,135 10.23 27,819 30,584 3,523,553 7.75 3,594,586 7.21 12,406,292 9.61 1,080,632 12.24 33,257 34,180 27,153 30,617 29,806 30,697 7.24 8.12 26,946 4,198,068 8.15 770,883 7.68 5,900,962 6.92 22,490,022 9.77 2,389,039 621,394 7,459,827 6,203,788 6.40 1,815,354 6.25 5,509,026 9.10 506,529 12.99 11.03 8.02 13.04 9.91 10.91 10.16 7.24 8.65 5,756,577 9.00 11.40 12 13 14 15 16 17 18 23 24 25 26 27 28 29 30 31 32 3 34 35 35 37 38 39 40 1 2 3 4 45 46 7 48 49 50 51 52 3 50 2004 Nebraska 8,757 2004 Nevada 10,673 2004 ew Hampsh 4,282 2004 New Jerse 28,020 33 2004 New Mexic 5,635 2004 New York 47,379 2004 orth Caroli 51,717 36 2004 orth Dako 3,663 2004 Ohio 50,300 2004 Oklahoma 19,699 Oregon 18,001 2004 ennsylvan 50,663 2004 hode Islar 3,000 buth Carol 27,910 outh Dakd 3,696 41 B C A Year State Milkwh 2004 Alabama 30,109 2004 Alaska 2,062 43 42 2004 2004 2004 7,325 44 2004 Tennesse 38,526 2004 Texas 120,330 Utah 47 2004 Vermont 2,109 2004 Virginia 42,503 2004 Washingto 32,455 2004 Vest Virgin 10,756 2004 Wisconsin 21,192 2004 Wyoming 2,262 25,364 54 2004 53 Means D Pop 4,530,182 655,435 E F Pkwh PGas 7.65 13.34 12.48 4.88 8.49 12.16 28,609 7.39 11.73 25,724 12.56 9.86 35,172 36,109 1,262,840 1,393,262 8.47 14.06 G Income 27,630 34,085 11.11 12.27 13.24 12.00 9.52 10.60 10.37 45,506 35,559 52,101 31,460 30,074 32,606 26,839 34,725 30,070 30,970 31,003 27,151 31,737 36,175 35,017 25,681 32,063 34,199 32,345 H
Step by Step Solution
3.41 Rating (154 Votes )
There are 3 Steps involved in it
1 Using the above data run a linear regression of Dependent Variable Milkwh Explanatory Variables Pop Pkwh PGas Income Which coefficients including the constant are statistically significant at the 10 ... View full answer

Get step-by-step solutions from verified subject matter experts