

Question: Using the accompanying Student Grades data, construct a scatter chart for midterm versus final exam grades and add a linear trendline. What is the

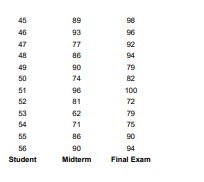
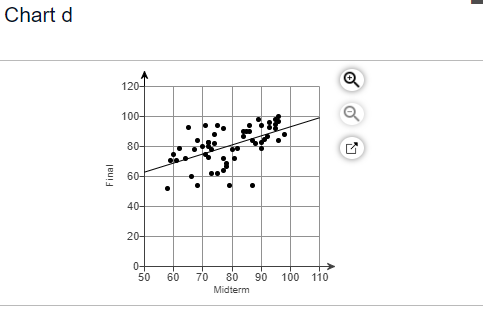
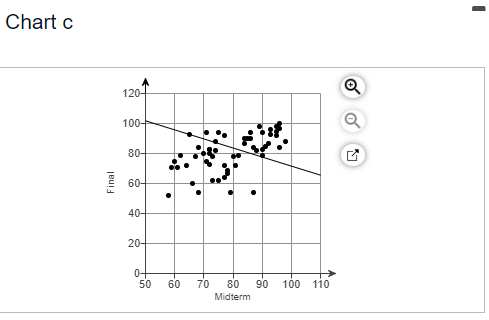
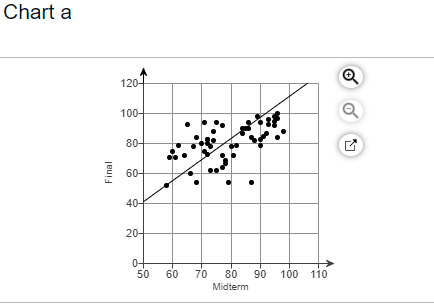
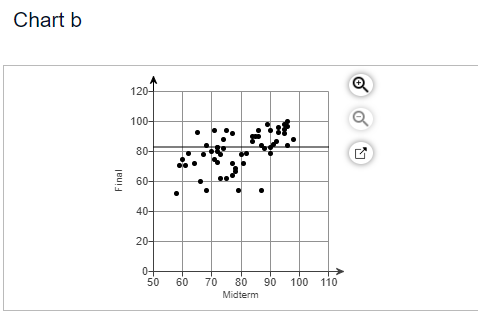
Using the accompanying Student Grades data, construct a scatter chart for midterm versus final exam grades and add a linear trendline. What is the model? If a student scores 77 on the midterm, what would you predict her grade on the final exam to be? Click the icon to view the Student Grades data. Choose the correct scatter chart and linear trendline for the data. Click here to view chart d. Click here to view chart c. Click here to view chart a. Click here to view chart b. What is the model for the trendline? Final Exam Grade = + Midterm Grade (Round to three decimal places as needed.) If a student scores 77 on the midterm, her predicted final exam grade would be (Round to the nearest whole number as needed.) Student Midterm Final Exam 1 77 64 2 84 90 3 78 67 87 84 75 62 67 78 77 72 95 92 66 60 2223225232 8 9 5 2 2 3 91 85 79 54 88 82 87 54 64 72 92 87 74 88 70 80 93 93 80 78 59 71 68 72 60 68 84 73 2332 79 69 97 94 80 83 73 90 95 85 95 835 45 89 46 93 96 47 77 92 48 86 94 49 90 79 50 74 82 51 96 100 52 81 72 53 62 79 54 71 75 55 86 90 56 90 94 Student Midterm Final Exam Chart d Final 120 100- Q Q 80- 60- 40- 20- 0+ 50 -0 60 50 70 80 90 Midterm 100 110 LV Chart c Final 120- 100- 80- 60- 40- 20- 0+ +o 50 60 70 80 90 100 110 Midterm Chart a Final 120- 100- 80- 60- 40- 20- 0+ 50 60 70 80 90 100 110 Midterm Chart b Final 120 100- 80- 60- 40- 20- 0- 50 60 70 80 90 100 110 Midterm Q
Step by Step Solution
There are 3 Steps involved in it

Get step-by-step solutions from verified subject matter experts