

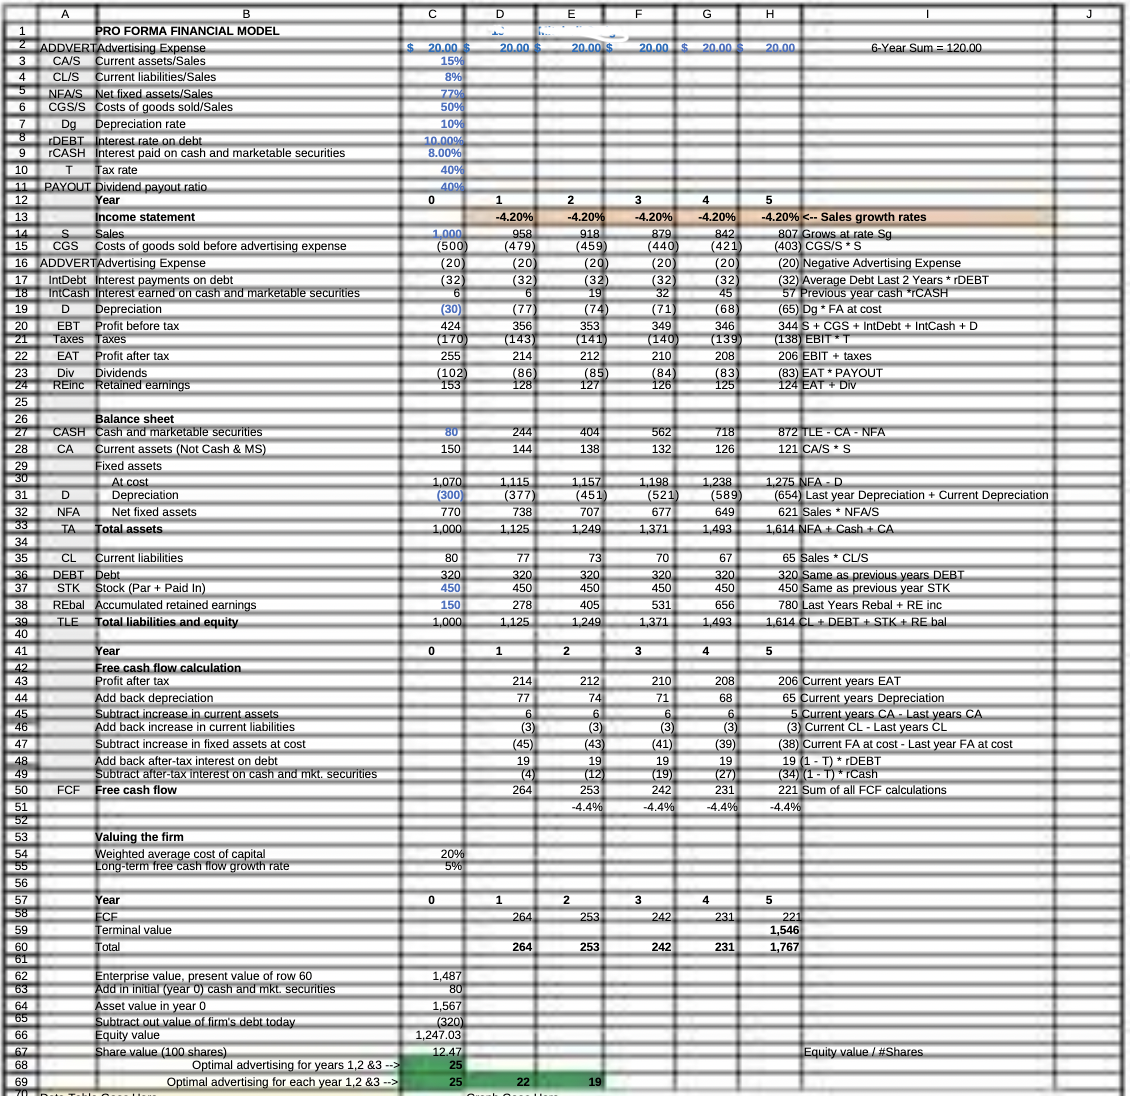
Question: Using the assignment instructions and the spreadsheet below, how should the formulas for cells D2:F2 be written? I know how to complete the data table
Using the assignment instructions and the spreadsheet below, how should the formulas for cells D2:F2 be written? I know how to complete the data table but I am unable to figure out what formula connects the advertising budgets in cells D2:F2 to the equity valuation in cell C66.
Instructions: Build a data table and graph to show what happens to the equity value for different
advertising budgets in years 1-3 if the same amount is spent on advertising in each of
those three years. Use the shaded regions starting in A69 with advertising amounts from
$0 to $30 in $1 increments. You will need to alter cells D2:F2 to complete the analysis. The company is unable to spend more than $100 in any given year on advertising.
Spreadsheet Given:
Step by Step Solution
There are 3 Steps involved in it

Get step-by-step solutions from verified subject matter experts