

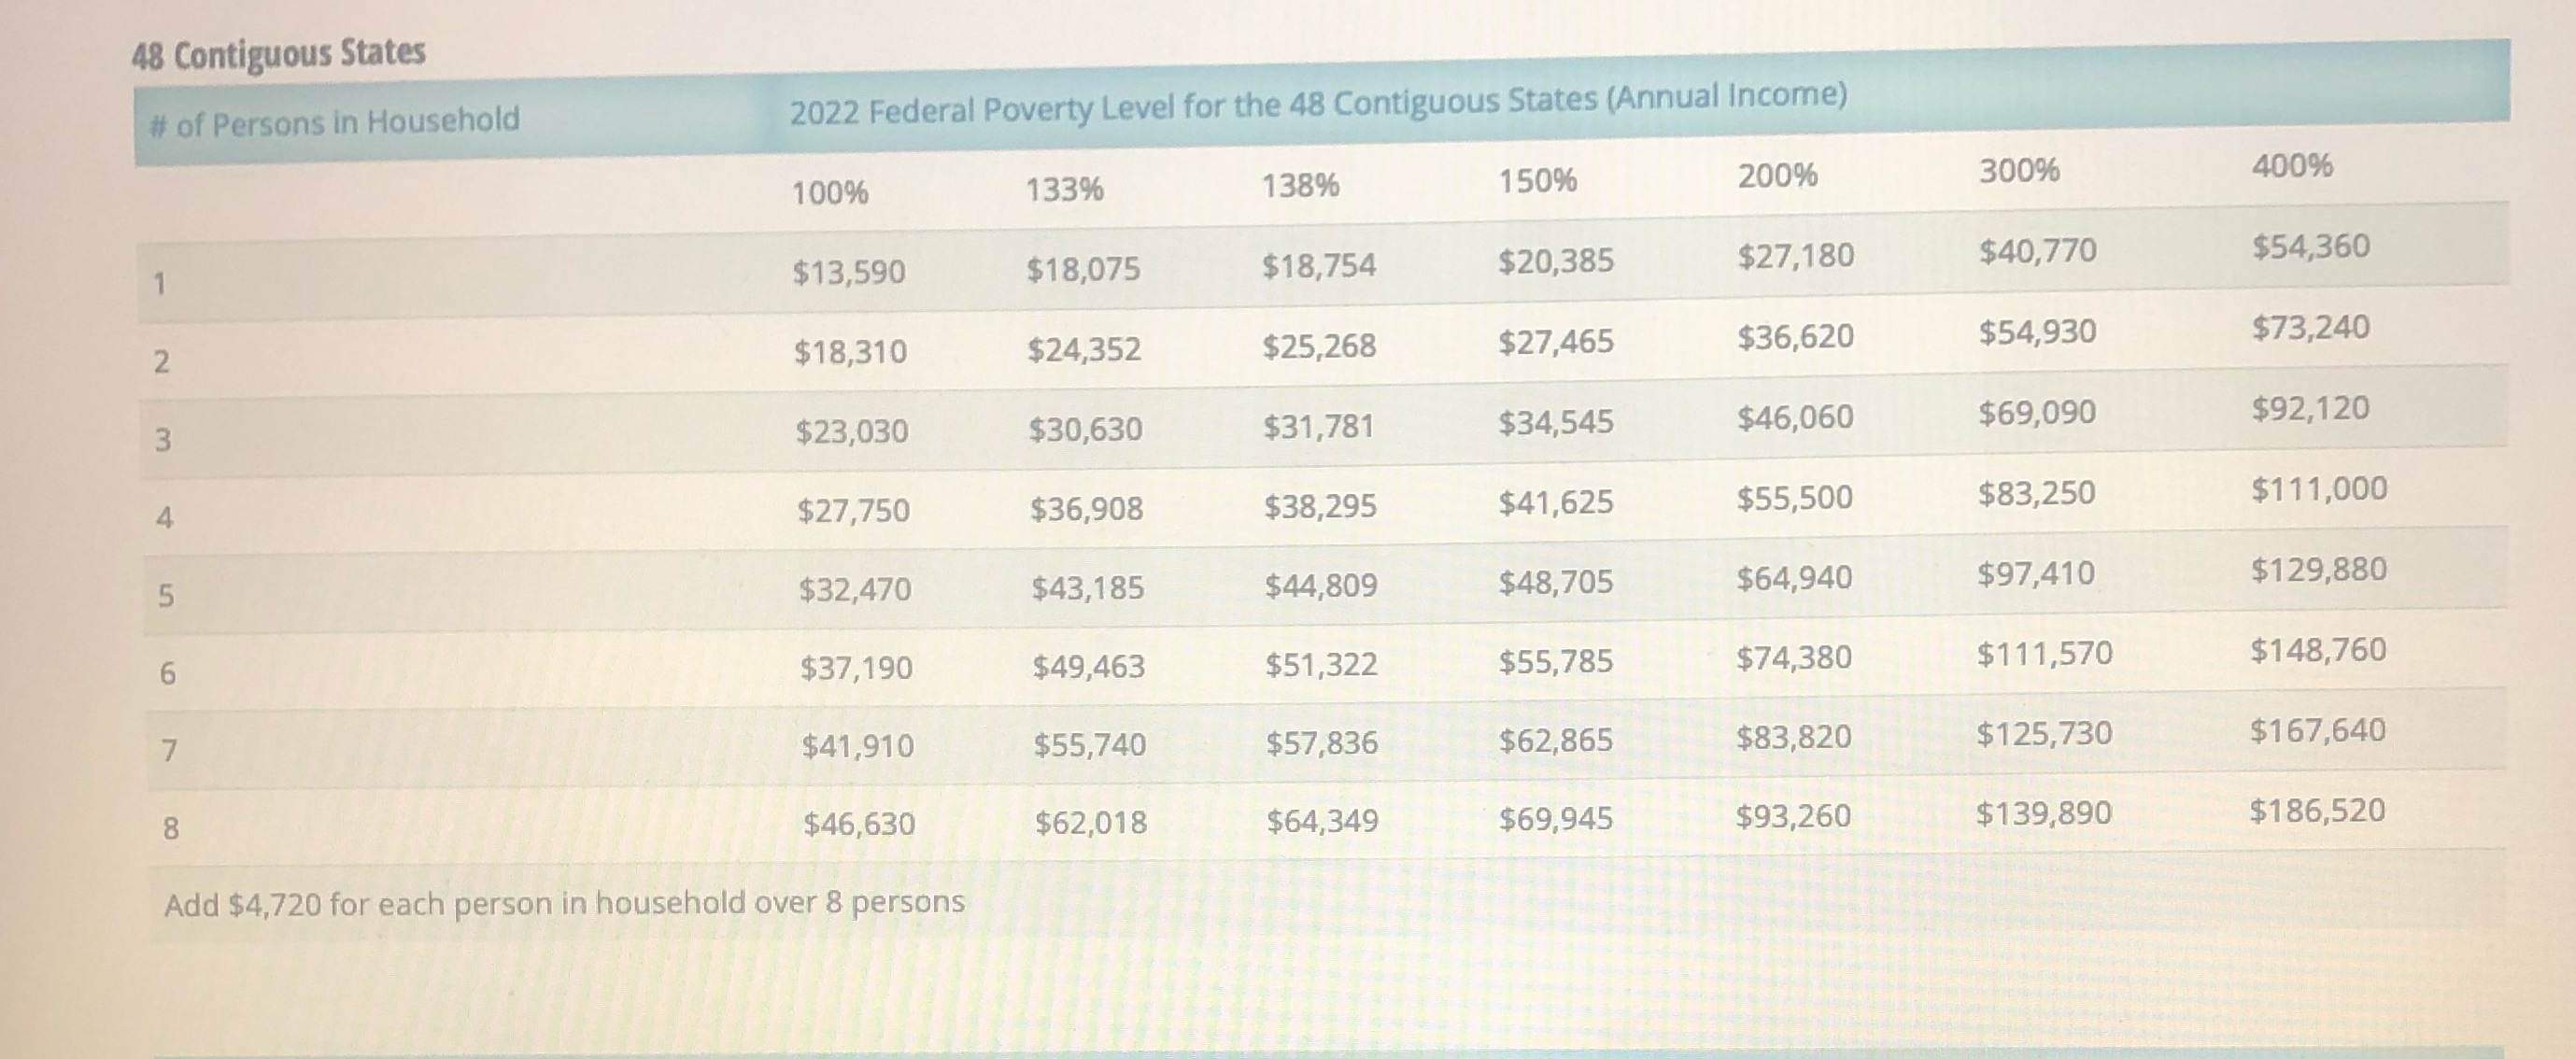
Question: Using the attached chart: if a single person makes $35,000 a year what is their poverty level percentage? 48 Contiguous States # of Persons in
Using the attached chart: if a single person makes $35,000 a year what is their poverty level percentage?
Step by Step Solution
There are 3 Steps involved in it
1 Expert Approved Answer
Step: 1 Unlock

Question Has Been Solved by an Expert!
Get step-by-step solutions from verified subject matter experts
Step: 2 Unlock
Step: 3 Unlock