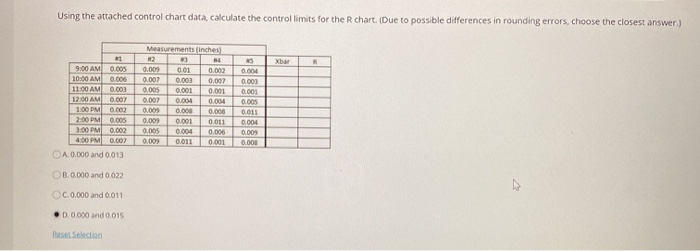
Question: Using the attached control chart data, calculate the control limits for the R chart. (Due to possible differences in rounding errors, choose the closest answer.)

Using the attached control chart data, calculate
Using the attached control chart data, calculate the control limits for the R chart. (Due to possible differences in rounding errors, choose the closest answer.) 9:00 AM 10:00 AM 11:00 AM 12:00 AM 1:00 PM 2:00 PM 0.00 0.005 0.00 0.007 0.002 0.00 Measurements inches 2 0.009 0.01 0.002 0.004 0.007 0.003 0.007 0.003 0.00 0.00 0.00 0001 0.007 0.0040.0040.005 0.003 0.00 0 .000 0.00 0.0010.0110.004 0.00 0.0110 .001 0.008 4:00 PM 0.00 A. 0.000 and 0.013 B0.000 and 0.022 C0.000 and 0011 OD.0000 and 0.015 pase selected Using the attached control chart data, calculate the control limits for the R chart. (Due to possible differences in rounding errors, choose the closest answer.) 9:00 AM 10:00 AM 11:00 AM 12:00 AM 1:00 PM 2:00 PM 0.00 0.005 0.00 0.007 0.002 0.00 Measurements inches 2 0.009 0.01 0.002 0.004 0.007 0.003 0.007 0.003 0.00 0.00 0.00 0001 0.007 0.0040.0040.005 0.003 0.00 0 .000 0.00 0.0010.0110.004 0.00 0.0110 .001 0.008 4:00 PM 0.00 A. 0.000 and 0.013 B0.000 and 0.022 C0.000 and 0011 OD.0000 and 0.015 pase selected

Step by Step Solution

There are 3 Steps involved in it

1 Expert Approved Answer
Step: 1 Unlock blur-text-image
Question Has Been Solved by an Expert!

Get step-by-step solutions from verified subject matter experts

Step: 2 Unlock
Step: 3 Unlock

Students Have Also Explored These Related General Management Questions!