

Question: using the attached graph, analyze and interpret the results shown. the graph shows emissions of air pollutants for different tiers for the state of Iowa.
using the attached graph, analyze and interpret the results shown. the graph shows emissions of air pollutants for different tiers for the state of Iowa. 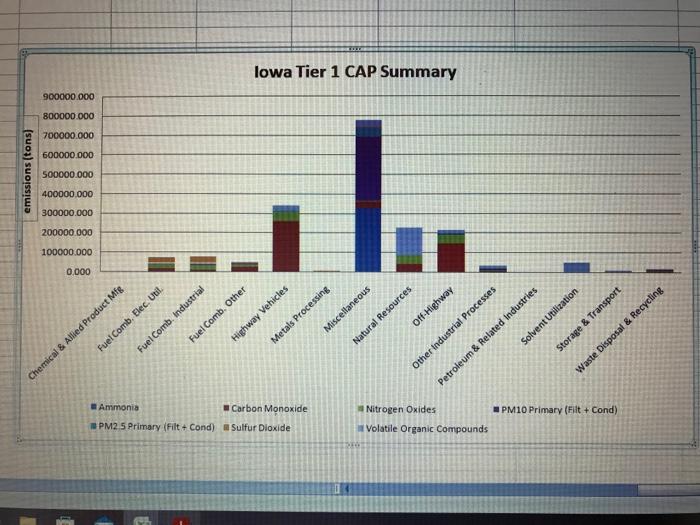
lowa Tier 1 CAP Summary 900000.000 800000.000 700000.000 600000.000 emissions (tons) 500000.000 400000.000 300000.000 200000.000 100000.000 0.000 Fuel Comb. Elec. Util. Highway Vehicles Miscellaneous Off-Highway Storage & Transport Fuel Comb. Other Metals Processing Fuel Comb. Industrial Natural Resources Solvent Utilization Other Industrial Processes Waste Disposal & Recycling Chemical & Allied Product Mfg Petroleum & Related Industries Ammonia Carbon Monoxide PM2 5 Primary Filt + Cond) Sulfur Dioxide Nitrogen Oxides Volatile Organic Compounds PM10 Primary (Fit + Cond)
Step by Step Solution
There are 3 Steps involved in it
1 Expert Approved Answer
Step: 1 Unlock

Question Has Been Solved by an Expert!
Get step-by-step solutions from verified subject matter experts
Step: 2 Unlock
Step: 3 Unlock