

Question: using the attached spreadsheet, determine the effect eacg of the journal entries would have on the attached ratios ABC Company General Journal Page 1 a.
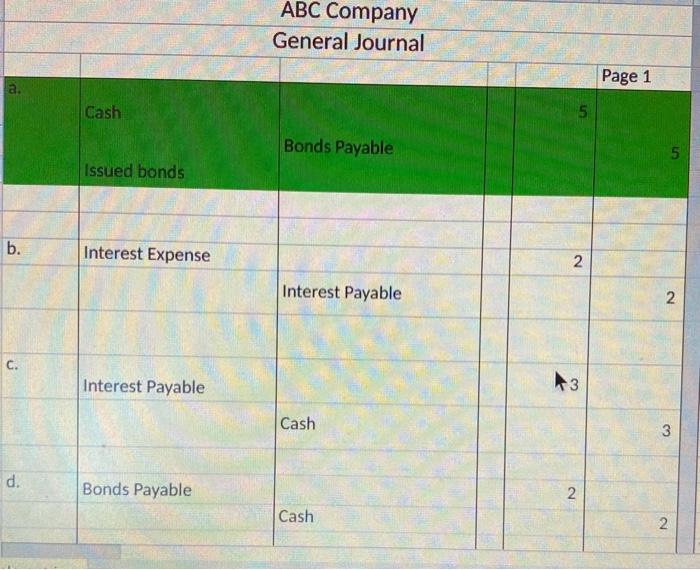
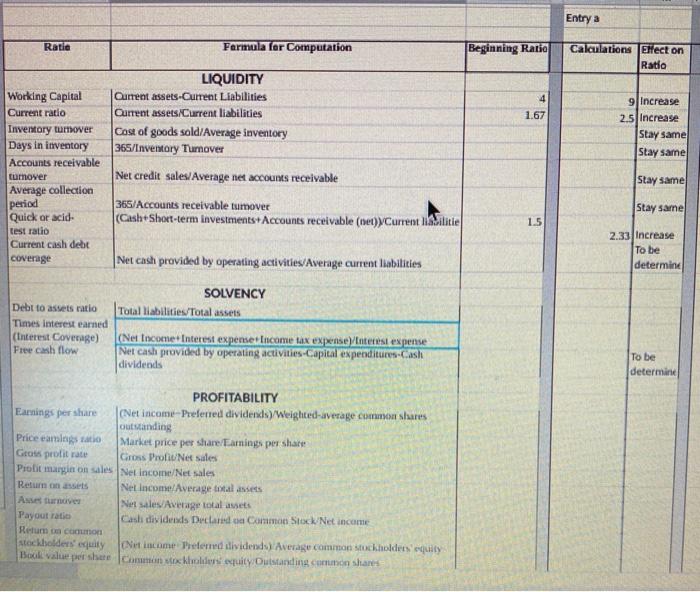
ABC Company General Journal Page 1 a. Cash 5 Bonds Payable 5 Issued bonds b. Interest Expense N Interest Payable 2. C. Interest Payable 3 Cash d. Bonds Payable 2 Cash 2 Entry a Ratic Formula for Computation Beginning Ratio Calculations Effect on Ratia 4 1.67 9 Increase 2.5 Increase Stay samel Stay same Stay same Stay same LIQUIDITY Working Capital Current assets-Current Liabilities Current ratio Current assets/Current liabilities Inventory tumover Cost of goods sold/Average inventory Days in inventory 365/Inventory Tumover Accounts receivable turnover Net credit sales/Average net accounts receivable Average collection period 365/Accounts receivable tumover Quick or acid (Cash-Short-term investments Accounts receivable (net) Current lite test ratio Current cash debt coverage Net cash provided by operating activities/Average current liabilities SOLVENCY Debt to assets ratio Total liabilities/Total assets Times interest earned (Interest Coverage) (Nettocome+Interest expense Income tax expensenterest expense Free cash flow Net cash provided by operating activities-Capital expenditures-Cash dividends 1.5 2.33 increase To be determine To be determine PROFITABILITY Earnings per share (Net income-Preferred dividends)/Weighted average common shares outstanding Price eamingstatio Market price per share/Earnings per share Geosprotitrate Gross ProfiNet Sales Probit margin on sales Net Income/Net sales Return on Net Income/Average total assets Net sales/Average total asets Payout ratio Cash dividends Declared a Common StoxNet income Ketum con stockholders uity Net income Preferred dividends) Average common stockholders equity Book value pwr share common kholders equity. Outstanding common shares Entry Entry a Entry a Entry a Entry a Entry a Calculations Calculations CACnitions Calculations CACHINES Entryb CACILLE Entryd Entry Entry Entry e Entry ABC Company General Journal Page 1 a. Cash 5 Bonds Payable 5 Issued bonds b. Interest Expense N Interest Payable 2. C. Interest Payable 3 Cash d. Bonds Payable 2 Cash 2 Entry a Ratic Formula for Computation Beginning Ratio Calculations Effect on Ratia 4 1.67 9 Increase 2.5 Increase Stay samel Stay same Stay same Stay same LIQUIDITY Working Capital Current assets-Current Liabilities Current ratio Current assets/Current liabilities Inventory tumover Cost of goods sold/Average inventory Days in inventory 365/Inventory Tumover Accounts receivable turnover Net credit sales/Average net accounts receivable Average collection period 365/Accounts receivable tumover Quick or acid (Cash-Short-term investments Accounts receivable (net) Current lite test ratio Current cash debt coverage Net cash provided by operating activities/Average current liabilities SOLVENCY Debt to assets ratio Total liabilities/Total assets Times interest earned (Interest Coverage) (Nettocome+Interest expense Income tax expensenterest expense Free cash flow Net cash provided by operating activities-Capital expenditures-Cash dividends 1.5 2.33 increase To be determine To be determine PROFITABILITY Earnings per share (Net income-Preferred dividends)/Weighted average common shares outstanding Price eamingstatio Market price per share/Earnings per share Geosprotitrate Gross ProfiNet Sales Probit margin on sales Net Income/Net sales Return on Net Income/Average total assets Net sales/Average total asets Payout ratio Cash dividends Declared a Common StoxNet income Ketum con stockholders uity Net income Preferred dividends) Average common stockholders equity Book value pwr share common kholders equity. Outstanding common shares Entry Entry a Entry a Entry a Entry a Entry a Calculations Calculations CACnitions Calculations CACHINES Entryb CACILLE Entryd Entry Entry Entry e Entry
Step by Step Solution
There are 3 Steps involved in it

Get step-by-step solutions from verified subject matter experts