

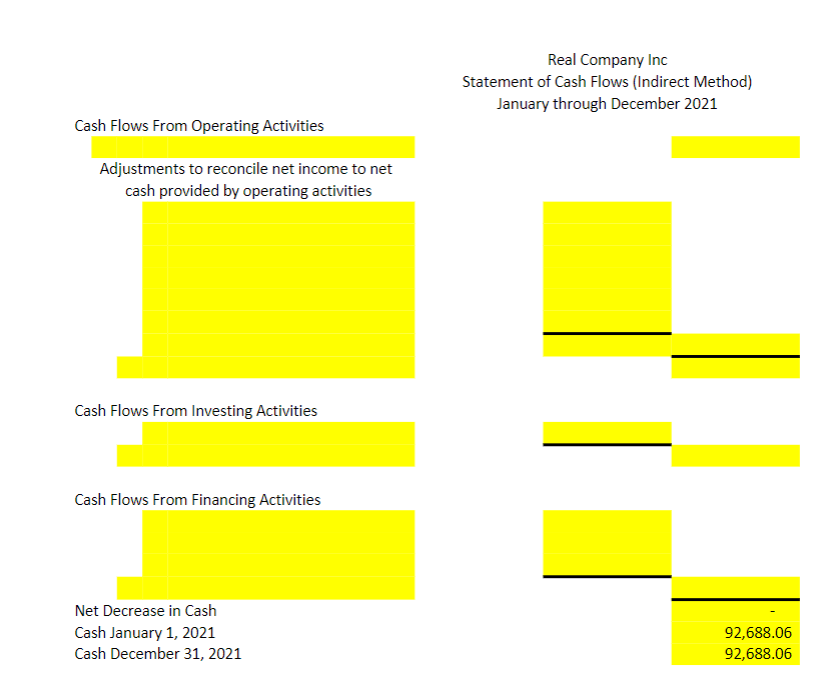
Question: Using the balance sheet and income statement, complete the statement of cash flows spreadsheet (yellow boxes) using the indirect method. Real Company Inc Balance Sheet
Using the balance sheet and income statement, complete the statement of cash flows spreadsheet (yellow boxes) using the indirect method.
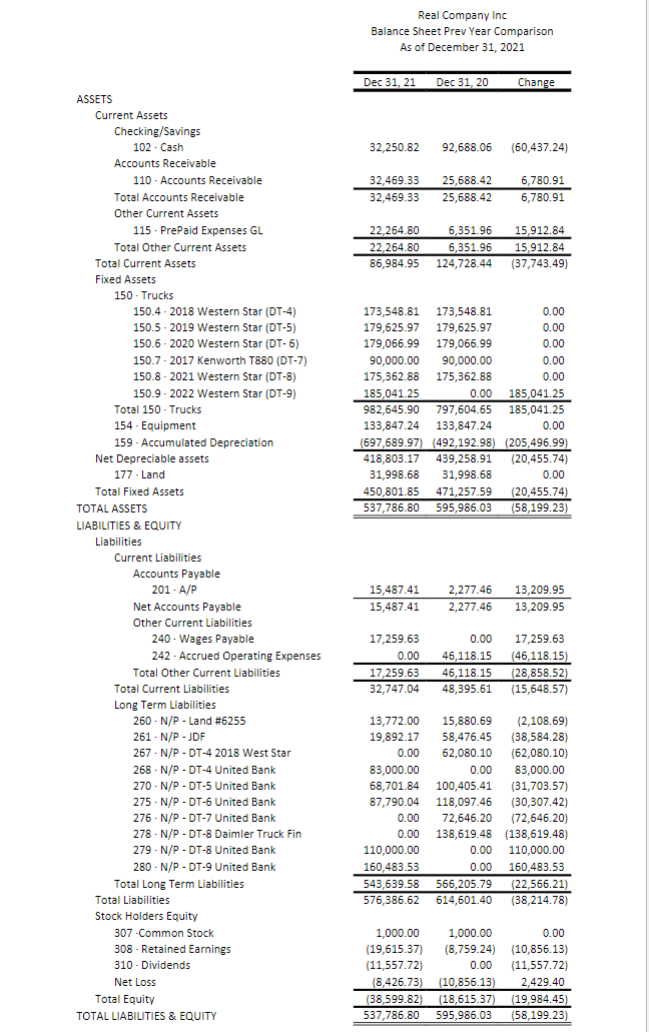
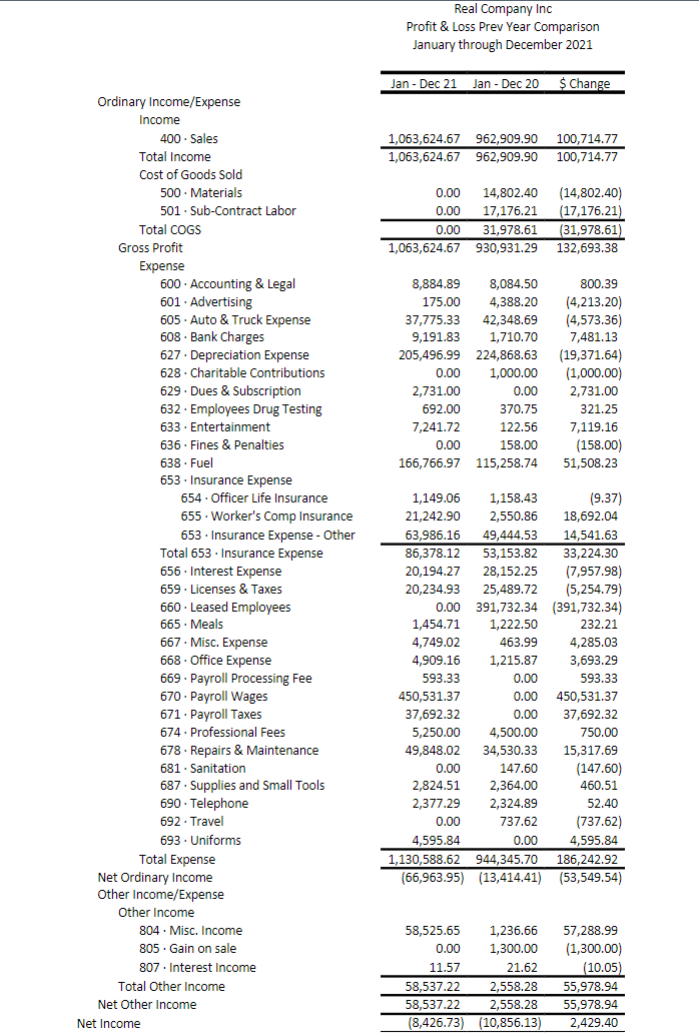
Real Company Inc Balance Sheet Prev Year Comparison As of December 31, 2021 Dec 31, 21 Dec 31, 20 Change 32,250.82 92,688.06 (60,437.24) ASSETS Current Assets Checking/Savings 102 - Cash Accounts Receivable 110 - Accounts Receivable Total Accounts Receivable Other Current Assets 115. PrePaid Expenses GL Total Other Current Assets Total Current Assets 32,469.33 32,469.33 25,688.42 25,688.42 6,780.91 6,780.91 22.264.80 22,264.80 86,984.95 6,351.96 6,351.96 124,728.44 15,912.84 15,912.84 (37,743.49) Fixed Assets 173,548.81 173,548.81 0.00 179,625.97 179,625.97 0.00 179,066.99 179,066.99 0.00 90,000.00 90,000.00 0.00 175,362.88 175,362.88 0.00 185,041.25 0.00 185,041.25 982,645.90 797,604.65 185,041.25 133,847.24 133,847.24 000 0.00 (697,689.97) (492,192.98) (205,496.99) 418,803.17 439,258.91 (20,455.74) 31,998.68 31,998.68 0.00 450,801.85 471,257.59 (20,455.74) 537,786.80 595,986.03 (58,199.23) 15,487.41 15,487.41 2,277.46 13,209.95 2,277.46 13,209.95 150 Trucks 150.4.2018 Western Star (DT-4) 150.5.2019 Western Star (DT-5) 150.6.2020 Western Star (DT-6) 150.7-2017 Kenworth T880 (DT-7) 150.8.2021 Western Star (DT-8) 150.9.2022 Western Star (DT-9) Total 150 Trucks 154 - Equipment 159. Accumulated Depreciation Net Depreciable assets 177. Land Total Fixed Assets TOTAL ASSETS LIABILITIES & EQUITY Liabilities Current Liabilities Accounts Payable 201. A/P Net Accounts Payable Other Current Liabilities 240 . Wages Payable 242. Accrued Operating Expenses Total Other Current Liabilities Total Current Liabilities wa Long Term Liabilities cs 260 N/P - Land #6255 261 - N/P - JDF /P 267 - N/P - DT-4 2018 West Star N4 268. N/P - DT-4 United Bank *** 270 - N/P - DT-5 United Bank *** 275 N/P - DT-6 United Bank 276. N/P - DT-7 United Bank 278. N/P - DT-8 Daimler Truck Fin 279. N/P - DT-8 United Bank 280 - N/P - DT-9 United Bank Total Long Term Liabilities Total Liabilities Stock Holders Equity 307-Common Stock 308 - Retained Earnings 310 - Dividends Net Loss Total Equity TOTAL LIABILITIES & EQUITY 17,259.63 0.00 17,259.63 32,747.04 0.00 46,118.15 46,118.15 48,395.61 17,259.63 (46,118.15) (28,858.52) (15,648.57) 13,772.00 15,880.69 (2,108.69) 19,892.17 58,476.45 (38,584.28) 0.00 62,080.10 (62,080.10) 83,000.00 0.00 83,000.00 w.. . 68,701.84 100,405.41 (31,703.57) 9.3 87,790.04 118,097.46 (30,307.42) 0.00 72,646.20 (72,646.20) 0.00 138,619.48 (138,619.48) () 110,000.00 0.00 110,000.00 160,483.53 0.00 160,483.53 543,639.58 566,205.79 (22,566.21) 576,386.62 614,601.40 (38,214.78) 1,000.00 1,000.00 0.00 (19,615.37) (8,759.24) (10,856.13) (11,557.72) 0.00 (11,557.72) (8,426.73) (10,856.13) 2,429.40 (38,599.82) (18,615.37) (19,984.45) 537,786.80 595,986.03 (58,199.23) Real Company Inc Profit & Loss Prev Year Comparison January through December 2021 Jan-Dec 21 Jan - Dec 20 $ Change 1,063,624.67 962,909.90 1,063,624.67 962,909.90 100,714.77 100,714.77 0.00 14,802.40 0.00 17,176.21 0.00 31,978.61 1,063,624.67 930,931.29 (14,802.40) (17,176.21) (31,978.61) 132,693.38 8,884.89 8,084.50 175.00 4,388.20 37,775.33 42.348.69 9,191.83 1,710.70 205,496.99 224,868.63 0.00 1,000.00 2,731.00 0.00 692.00 370.75 7,241.72 122.56 0.00 158.00 166,766.97 115,258.74 800.39 (4,213.20) (4,573.36) 7,481.13 (19,371.64) (1,000.00) 2,731.00 321.25 7,119.16 (158.00) 51,508.23 Ordinary Income/Expense Income 400 - Sales Total Income Cost of Goods Sold 500. Materials 501 Sub-Contract Labor Total COGS Gross Profit Expense 600 - Accounting & Legal 601 . Advertising 605 . Auto & Truck Expense 608. Bank Charges 627. Depreciation Expense 628. Charitable Contributions 629. Dues & Subscription 632. Employees Drug Testing 633. Entertainment 636. Fines & Penalties 638. Fuel 653. Insurance Expense 654 . Officer Life Insurance 655. Worker's Comp Insurance 653. Insurance Expense - Other Total 653 . Insurance Expense 656. Interest Expense 659 . Licenses & Taxes 660 . Leased Employees 665. Meals 667. Misc. Expense 668 Office Expense 669. Payroll Processing Fee 670. Payroll Wages 671. Payroll Taxes 674 . Professional Fees 678 . Repairs & Maintenance 681. Sanitation 687. Supplies and Small Tools 690. Telephone 692. Travel 693 - Uniforms Total Expense Net Ordinary Income Other Income/Expense Other Income 804 . Misc. Income 805. Gain on sale 807. Interest Income Total Other Income Net Other Income Net Income 1,149.06 1,158.43 (9.37) 21,242.90 2,550.86 18,692.04 63,986.16 49,444.53 14,541.63 86,378.12 53,153.82 33,224.30 20,194.27 28,152.25 (7,957.98) 20,234.93 25,489.72 (5,254.79) 0.00 391,732.34 (391,732.34) 1,454.71 1,222.50 232.21 4,749.02 463.99 4,285.03 4,909.16 1,215.87 3,693.29 593.33 0.00 593.33 450,531.37 0.00 450,531.37 37,692.32 0.00 37,692.32 5,250.00 4,500.00 750.00 49,848.02 34,530.33 15,317.69 0.00 147.60 (147.60) 2,824.51 2,364.00 460.51 2,324.89 52.40 0.00 737.62 (737.62) 4,595.84 0.00 4,595.84 1,130,588.62 944,345.70 186,242.92 (66,963.95) (13,414,41) (53,549.54) 2,377.29 58,525.65 1,236.66 0.00 1,300.00 11.57 21.62 58,537.22 2,558.28 58,537.22 2,558.28 (8,426.73) (10,856.13) 57,288.99 (1,300.00) (10.05 55,978.94 55,978.94 2,429.40 Real Company Inc Statement of Cash Flows (Indirect Method) January through December 2021 Cash Flows From Operating Activities Adjustments to reconcile net income to net cash provided by operating activities Cash Flows From Investing Activities Cash Flows From Financing Activities Net Decrease in Cash Cash January 1, 2021 Cash December 31, 2021 92,688.06 92,688.06
Step by Step Solution
There are 3 Steps involved in it

Get step-by-step solutions from verified subject matter experts