

Question: Using the Balance Sheet, Income Statement and Cashflow Statement attached, analyse the financial position of the Wood-Dale Winery business. In your analysis consider (a) profit
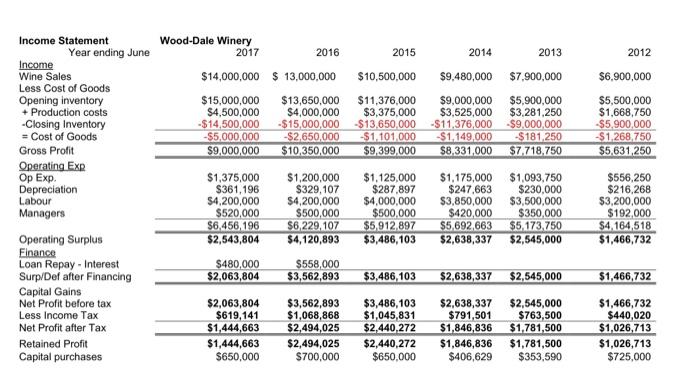
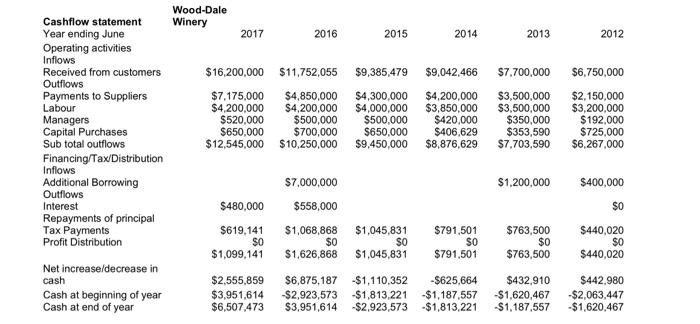
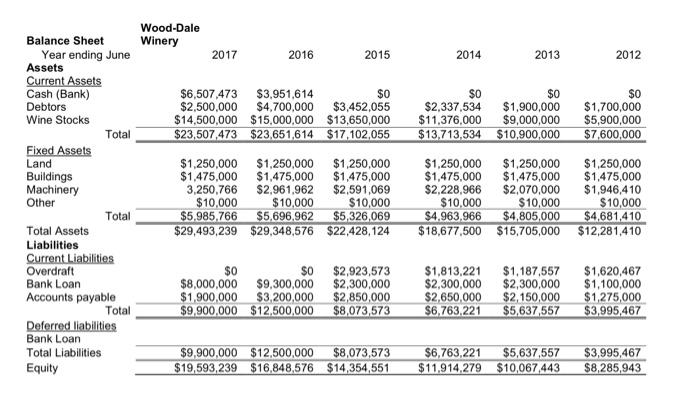
Using the Balance Sheet, Income Statement and Cashflow Statement attached, analyse the financial position of the Wood-Dale Winery business. In your analysis consider (a) profit margins, (b) cashflow, (c) level of investment, (d) returns on investment (e) any other points of interest (i) Provide comments on the current financial position of the business, and the long term financial trends of the business. (ii) Discuss strategies you would use to improve the financial position of the business. 2014 2013 2012 $6,900,000 Income Statement Year ending June Income Wine Sales Less Cost of Goods Opening inventory + Production costs -Closing Inventory = Cost of Goods Gross Profit Operating EXR Op Exp Depreciation Labour Managers Wood-Dale Winery 2017 2016 2015 $14,000,000 $ 13,000,000 $10,500,000 $15,000,000 $13,650,000 $11,376,000 $4,500,000 $4,000,000 $3,375,000 -$14,500,000 -$15,000,000 $13.650.000 -$5,000,000 -$2,650,000 $1.101.000 $9,000,000 $10.350,000 $9,399.000 $9,480,000 $7,900,000 $9,000,000 $5,900,000 $3,525,000 $3,281,250 -$11.376,000 $9,000,000 $1,149,000 $181 250 $8,331,000 $7.718.750 $5,500,000 $1,668,750 $5.900.000 $1,268,750 $5.631,250 $1,375,000 $361, 196 $4,200,000 $520,000 $6,456, 196 $2,543,804 $1,200,000 $329,107 $4,200,000 $500,000 $6,229.107 $4,120,893 $1,125.000 $287.897 $4,000,000 $500,000 $5,912,897 $3,486,103 $1,175,000 $247,663 $3,850,000 $420,000 $5,692,663 $2,638,337 $1,093,750 $230,000 $3,500,000 $350,000 $5.173.750 $2,545,000 $556,250 $216,268 $3,200,000 $192,000 $4,164,518 $1,466,732 $480,000 $2,063,804 $558,000 $3,562,893 $3,486,103 $2,638,337 $2,545,000 $1,466,732 Operating Surplus Finance Loan Repay - Interest Surp/Def after Financing Capital Gains Net Profit before tax Less Income Tax Net Profit after Tax Retained Profit Capital purchases $2,063,804 $619,141 $1,444,663 $1,444,663 $650,000 $3,562,893 $1,068,868 $2,494,025 $2,494,025 $700,000 $3,486,103 $1,045,831 $2,440,272 $2,440,272 $650,000 $2,638,337 $791,501 $1,846,836 $1,846,836 $406,629 $2,545,000 $763,500 $1.781,500 $1,781,500 $353,590 $1,466,732 $440,020 $1,026,713 $1,026,713 $725,000 Wood-Dale Winery 2017 2016 2015 2014 2013 2012 $9,385,479 $9,042,466 $16,200,000 $11,752,055 $7,175,000 $4,850,000 $4,200,000 $4,200,000 $520,000 $500,000 $650,000 $700,000 $12,545,000 $10,250,000 $4,300,000 $4,000,000 $500,000 $650,000 $9,450,000 $4,200,000 $3,850,000 $420,000 $406,629 $8,876,629 $7.700,000 $3,500,000 $3,500,000 $350,000 $353,590 $7,703,590 $6,750,000 $2,150,000 $3,200,000 $192,000 $725,000 $6,267,000 Cashflow statement Year ending June Operating activities Inflows Received from customers Outflows Payments to Suppliers Labour Managers Capital Purchases Sub total outflows Financing/Tax/Distribution Inflows Additional Borrowing Outflows Interest Repayments of principal Tax Payments Profit Distribution Net increase/decrease in cash Cash at beginning of year Cash at end of year $7,000,000 $1.200,000 $400,000 $480,000 $558,000 $0 $619,141 $0 $1,099,141 $1,068,868 SO $1,626,868 $1,045,831 SO $1,045,831 $791,501 SO $791,501 $763,500 $0 $763,500 $440,020 $0 $440,020 $2,555,859 $3,951,614 $6,507,473 $6,875,187 $2,923,573 $3,951,614 -$1,110,352 -$1,813,221 $2,923,573 -$625,664 -$1,187,557 -$1,813,221 $432.910 -$1,620,467 $1,187,557 $442.980 -$2,063,447 $1,620,467 Wood-Dale Winery 2017 2016 2015 2014 2013 2012 $6,507,473 $3,951,614 $0 $2,500,000 $4,700,000 $3,452,055 $14,500,000 $15,000,000 $13,650,000 $23,507,473 $23.651,614 $17,102,055 $0 $0 $2,337,534 $1,900,000 $11,376,000 $9,000,000 $13.713,534 $10,900,000 $0 $1,700,000 $5,900,000 $7,600,000 Balance Sheet Year ending June Assets Current Assets Cash (Bank) Debtors Wine Stocks Total Fixed Assets Land Buildings Machinery Other Total Total Assets Liabilities Current Liabilities Overdraft Bank Loan Accounts payable Total Deferred liabilities Bank Loan Total Liabilities Equity $1,250,000 $1,250,000 $1,250,000 $1,475,000 $1,475,000 $1,475,000 3,250,766 $2,961,962 $2,591,069 $10,000 $10,000 $10,000 $5.985.766 $5,696.962 $5,326,069 $29,493,239 $29,348,576 $22,428,124 $1,250,000 $1,250,000 $1,475,000 $1,475,000 $2,228,966 $2,070,000 $10,000 $10,000 $4.963,966 $4,805,000 $18,677,500 $15,705,000 $1,250,000 $1,475,000 $1,946,410 $10,000 $4,681,410 $12,281,410 $0 $0 $8,000,000 $9,300,000 $1.900.000 $3,200,000 $9,900,000 $12,500,000 $2,923,573 $2,300,000 $2,850,000 $8,073,573 $1,813,221 $2,300,000 $2,650,000 $6.763.221 $1,187,557 $2,300,000 $2,150,000 $5,637,557 $1,620,467 $1,100,000 $1,275,000 $3,995,467 $9,900,000 $12.500,000 $8,073,573 $19,593,239 $16,848,576 $14,354,551 $6,763,221 $11.914,279 $5,637,557 $10,067,443 $3,995,467 $8,285,943 Using the Balance Sheet, Income Statement and Cashflow Statement attached, analyse the financial position of the Wood-Dale Winery business. In your analysis consider (a) profit margins, (b) cashflow, (c) level of investment, (d) returns on investment (e) any other points of interest (i) Provide comments on the current financial position of the business, and the long term financial trends of the business. (ii) Discuss strategies you would use to improve the financial position of the business. 2014 2013 2012 $6,900,000 Income Statement Year ending June Income Wine Sales Less Cost of Goods Opening inventory + Production costs -Closing Inventory = Cost of Goods Gross Profit Operating EXR Op Exp Depreciation Labour Managers Wood-Dale Winery 2017 2016 2015 $14,000,000 $ 13,000,000 $10,500,000 $15,000,000 $13,650,000 $11,376,000 $4,500,000 $4,000,000 $3,375,000 -$14,500,000 -$15,000,000 $13.650.000 -$5,000,000 -$2,650,000 $1.101.000 $9,000,000 $10.350,000 $9,399.000 $9,480,000 $7,900,000 $9,000,000 $5,900,000 $3,525,000 $3,281,250 -$11.376,000 $9,000,000 $1,149,000 $181 250 $8,331,000 $7.718.750 $5,500,000 $1,668,750 $5.900.000 $1,268,750 $5.631,250 $1,375,000 $361, 196 $4,200,000 $520,000 $6,456, 196 $2,543,804 $1,200,000 $329,107 $4,200,000 $500,000 $6,229.107 $4,120,893 $1,125.000 $287.897 $4,000,000 $500,000 $5,912,897 $3,486,103 $1,175,000 $247,663 $3,850,000 $420,000 $5,692,663 $2,638,337 $1,093,750 $230,000 $3,500,000 $350,000 $5.173.750 $2,545,000 $556,250 $216,268 $3,200,000 $192,000 $4,164,518 $1,466,732 $480,000 $2,063,804 $558,000 $3,562,893 $3,486,103 $2,638,337 $2,545,000 $1,466,732 Operating Surplus Finance Loan Repay - Interest Surp/Def after Financing Capital Gains Net Profit before tax Less Income Tax Net Profit after Tax Retained Profit Capital purchases $2,063,804 $619,141 $1,444,663 $1,444,663 $650,000 $3,562,893 $1,068,868 $2,494,025 $2,494,025 $700,000 $3,486,103 $1,045,831 $2,440,272 $2,440,272 $650,000 $2,638,337 $791,501 $1,846,836 $1,846,836 $406,629 $2,545,000 $763,500 $1.781,500 $1,781,500 $353,590 $1,466,732 $440,020 $1,026,713 $1,026,713 $725,000 Wood-Dale Winery 2017 2016 2015 2014 2013 2012 $9,385,479 $9,042,466 $16,200,000 $11,752,055 $7,175,000 $4,850,000 $4,200,000 $4,200,000 $520,000 $500,000 $650,000 $700,000 $12,545,000 $10,250,000 $4,300,000 $4,000,000 $500,000 $650,000 $9,450,000 $4,200,000 $3,850,000 $420,000 $406,629 $8,876,629 $7.700,000 $3,500,000 $3,500,000 $350,000 $353,590 $7,703,590 $6,750,000 $2,150,000 $3,200,000 $192,000 $725,000 $6,267,000 Cashflow statement Year ending June Operating activities Inflows Received from customers Outflows Payments to Suppliers Labour Managers Capital Purchases Sub total outflows Financing/Tax/Distribution Inflows Additional Borrowing Outflows Interest Repayments of principal Tax Payments Profit Distribution Net increase/decrease in cash Cash at beginning of year Cash at end of year $7,000,000 $1.200,000 $400,000 $480,000 $558,000 $0 $619,141 $0 $1,099,141 $1,068,868 SO $1,626,868 $1,045,831 SO $1,045,831 $791,501 SO $791,501 $763,500 $0 $763,500 $440,020 $0 $440,020 $2,555,859 $3,951,614 $6,507,473 $6,875,187 $2,923,573 $3,951,614 -$1,110,352 -$1,813,221 $2,923,573 -$625,664 -$1,187,557 -$1,813,221 $432.910 -$1,620,467 $1,187,557 $442.980 -$2,063,447 $1,620,467 Wood-Dale Winery 2017 2016 2015 2014 2013 2012 $6,507,473 $3,951,614 $0 $2,500,000 $4,700,000 $3,452,055 $14,500,000 $15,000,000 $13,650,000 $23,507,473 $23.651,614 $17,102,055 $0 $0 $2,337,534 $1,900,000 $11,376,000 $9,000,000 $13.713,534 $10,900,000 $0 $1,700,000 $5,900,000 $7,600,000 Balance Sheet Year ending June Assets Current Assets Cash (Bank) Debtors Wine Stocks Total Fixed Assets Land Buildings Machinery Other Total Total Assets Liabilities Current Liabilities Overdraft Bank Loan Accounts payable Total Deferred liabilities Bank Loan Total Liabilities Equity $1,250,000 $1,250,000 $1,250,000 $1,475,000 $1,475,000 $1,475,000 3,250,766 $2,961,962 $2,591,069 $10,000 $10,000 $10,000 $5.985.766 $5,696.962 $5,326,069 $29,493,239 $29,348,576 $22,428,124 $1,250,000 $1,250,000 $1,475,000 $1,475,000 $2,228,966 $2,070,000 $10,000 $10,000 $4.963,966 $4,805,000 $18,677,500 $15,705,000 $1,250,000 $1,475,000 $1,946,410 $10,000 $4,681,410 $12,281,410 $0 $0 $8,000,000 $9,300,000 $1.900.000 $3,200,000 $9,900,000 $12,500,000 $2,923,573 $2,300,000 $2,850,000 $8,073,573 $1,813,221 $2,300,000 $2,650,000 $6.763.221 $1,187,557 $2,300,000 $2,150,000 $5,637,557 $1,620,467 $1,100,000 $1,275,000 $3,995,467 $9,900,000 $12.500,000 $8,073,573 $19,593,239 $16,848,576 $14,354,551 $6,763,221 $11.914,279 $5,637,557 $10,067,443 $3,995,467 $8,285,943
Step by Step Solution
There are 3 Steps involved in it

Get step-by-step solutions from verified subject matter experts