

Question: Using the Balance Statement and the income statement, calculate the vertical and horizontal analysis for both the balance sheet and the income statement Calculate the
- Using the Balance Statement and the income statement, calculate the vertical and horizontal analysis for both the balance sheet and the income statement
- Calculate the financial ratios and insert your answers in the appropriate spaces provided below for each ratio for the two years
- Examine your vertical and horizontal analysis and the ratios you calculated and then: Identify and discuss the implications of any TWO red flags or unusual fluctuations you found on the Income statement and current assets section of the Balance Sheet (Do not discuss cash or cash equivalents)
- Exam the ratios and discuss TWO unusual ratios involving inventory and Accounts receivables
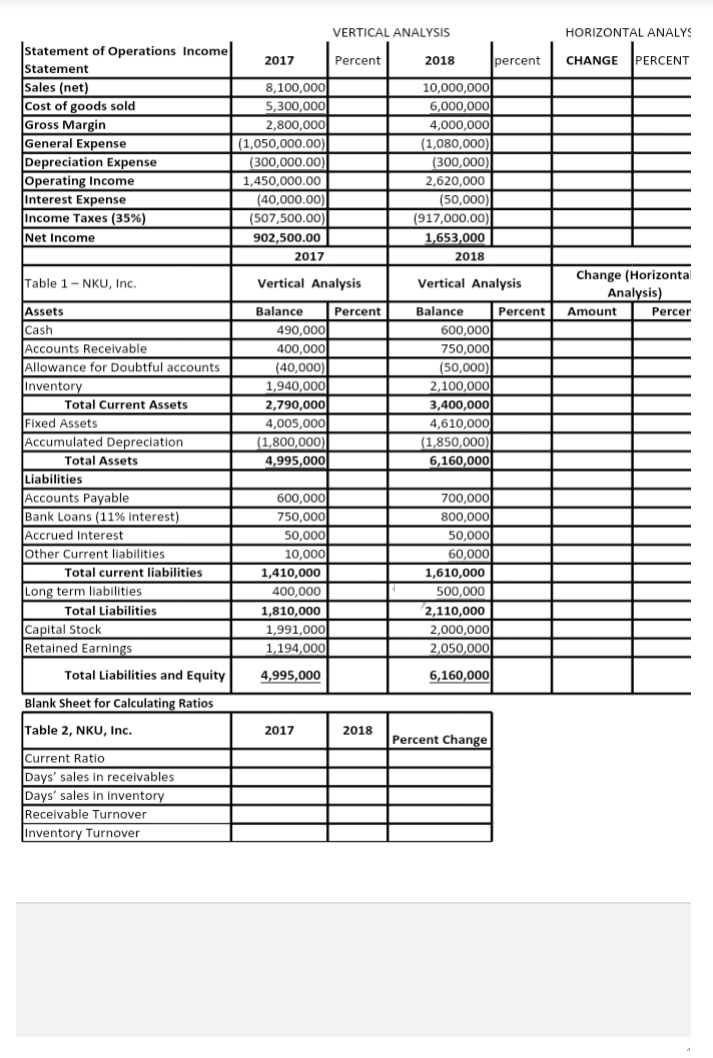
HORIZONTAL ANALYS CHANGE PERCENT VERTICAL ANALYSIS statement of Operations Income 2017 Percent 2018 percent Statement Sales (net) 8,100,0001 10,000,000 Cost of goods sold 5,300,000 6,000,000 Gross Margin 2,800,000 4,000,000 General Expense (1,050,000.00) (1,080,000) Depreciation Expense (300,000.00) (300,000) Operating Income 1,450,000.00 2,620,000 Interest Expense (40,000.00) (50,000) Income Taxes (35%) (507,500.00) (917,000.00) Net Income 902,500.00 1,653,000 2017 2018 Table 1 - NKU, Inc. Vertical Analysis Vertical Analysis Change (Horizontal Analysis) Amount Percer Percent Balance 490,000 400,000 (40,000) 1,940,000 2,790,000 4,005,000 (1,800,000) 4,995,000 1 Balance Percent 600,000 750,000 (50,000) 2,100,000 3,400,000 4,610,000 (1,850,000) 6,160,000 I Assets Cash Accounts Receivable Allowance for Doubtful accounts Inventory Total Current Assets Fixed Assets Accumulated Depreciation Total Assets 1 Liabilities Accounts Payable Bank Loans (11% interest) Accrued Interest Other Current liabilities Total current liabilities Long term liabilities Total Liabilities Capital Stock Retained Earnings Total Liabilities and Equity 600,000 750,000 50,000 10,000 1,410,000 400,000 1,810,000 1,991,000 1,194,000 700,000 800,000 50,000 60,000 1,610,000 500,000 2,110,000 2,000,000 2,050,000 4,995,000 6,160,000 Blank Sheet for Calculating Ratios Table 2, NKU, Inc. 2017 2018 Percent Change Current Ratio Days' sales in receivables Days' sales in inventory Receivable Turnover Inventory Turnover
Step by Step Solution
There are 3 Steps involved in it

Get step-by-step solutions from verified subject matter experts