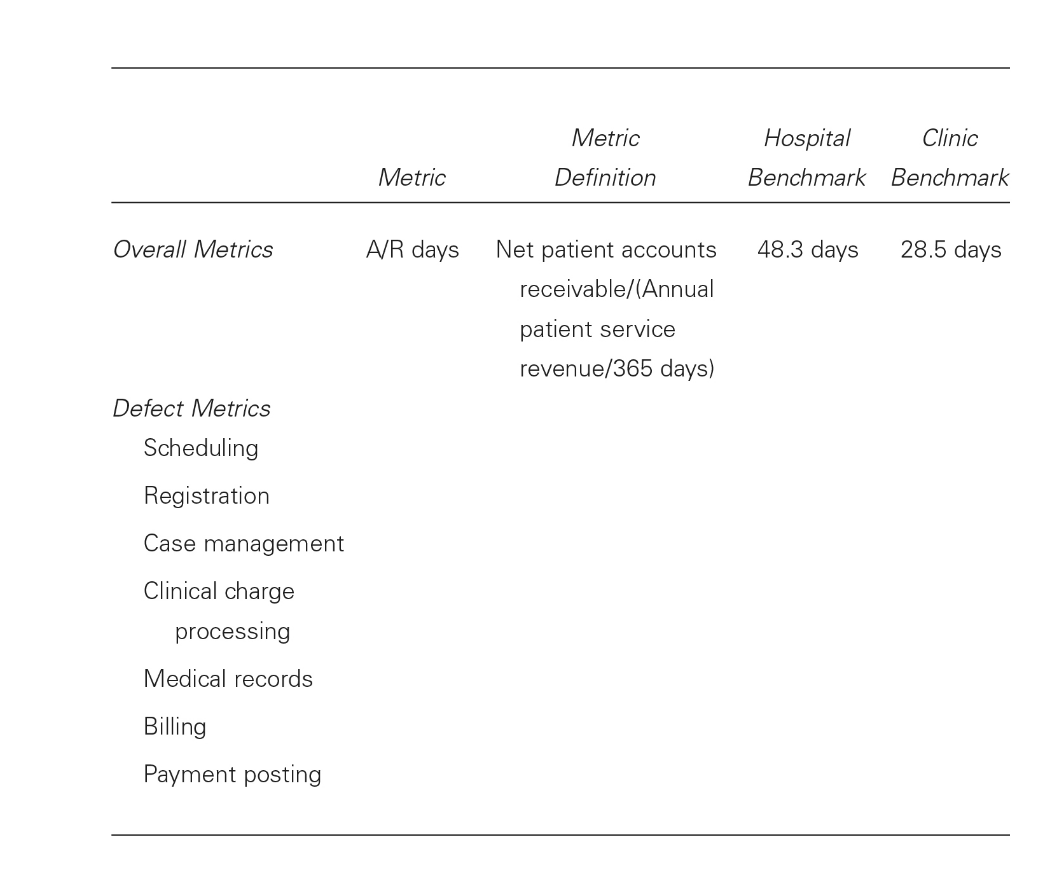
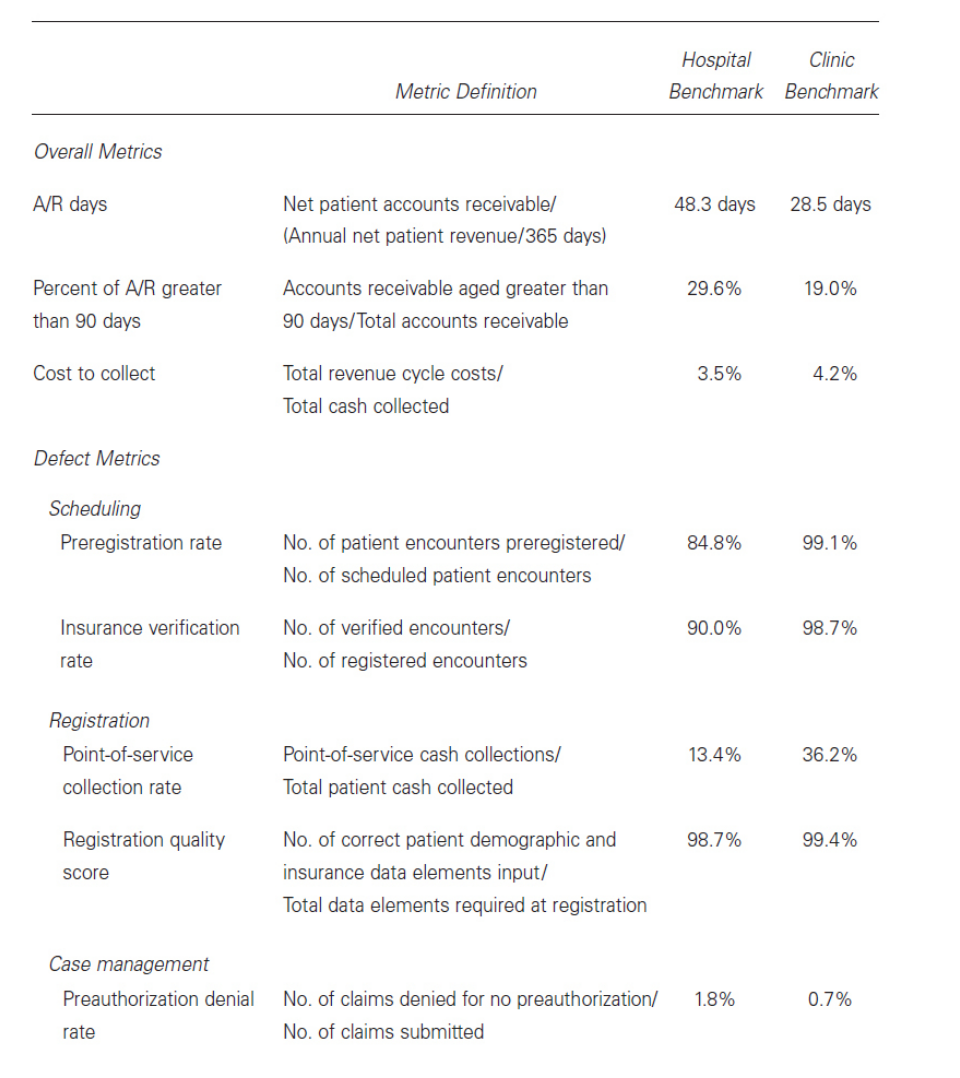
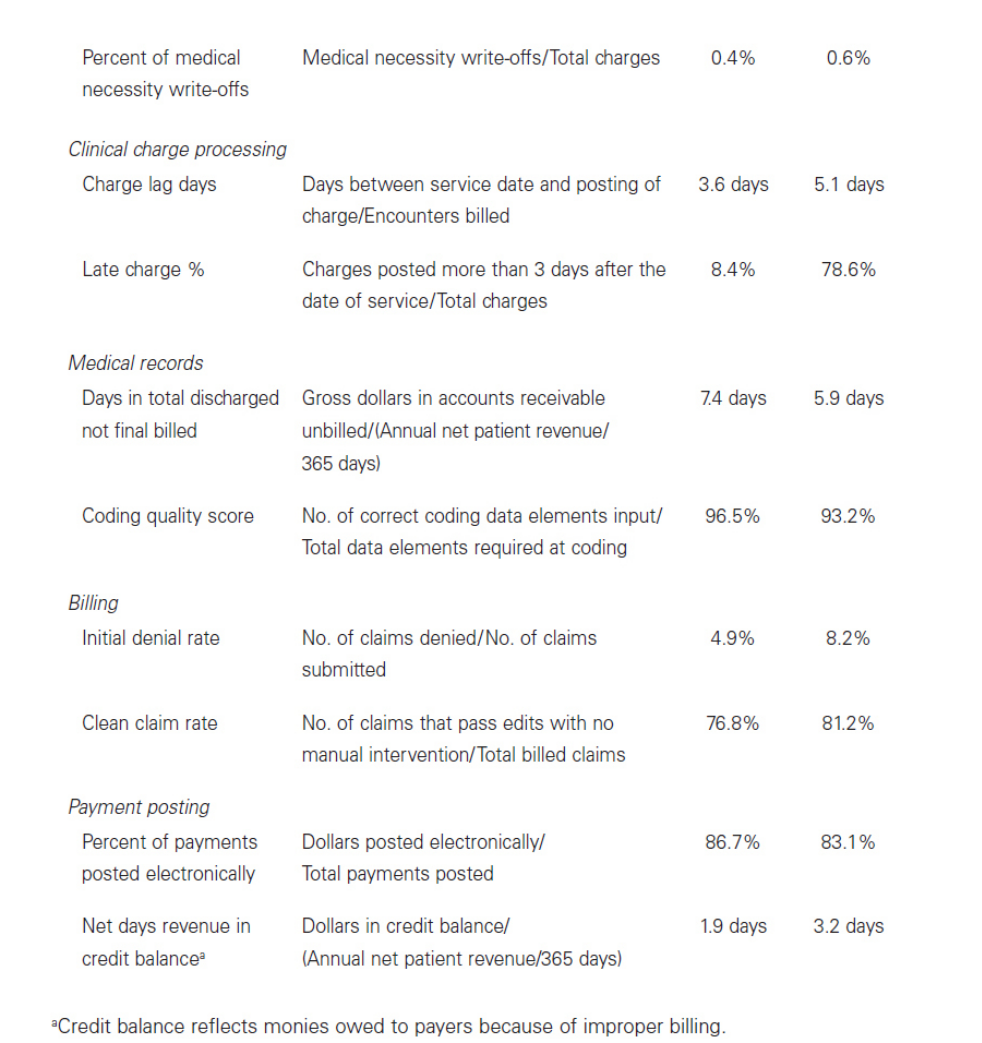
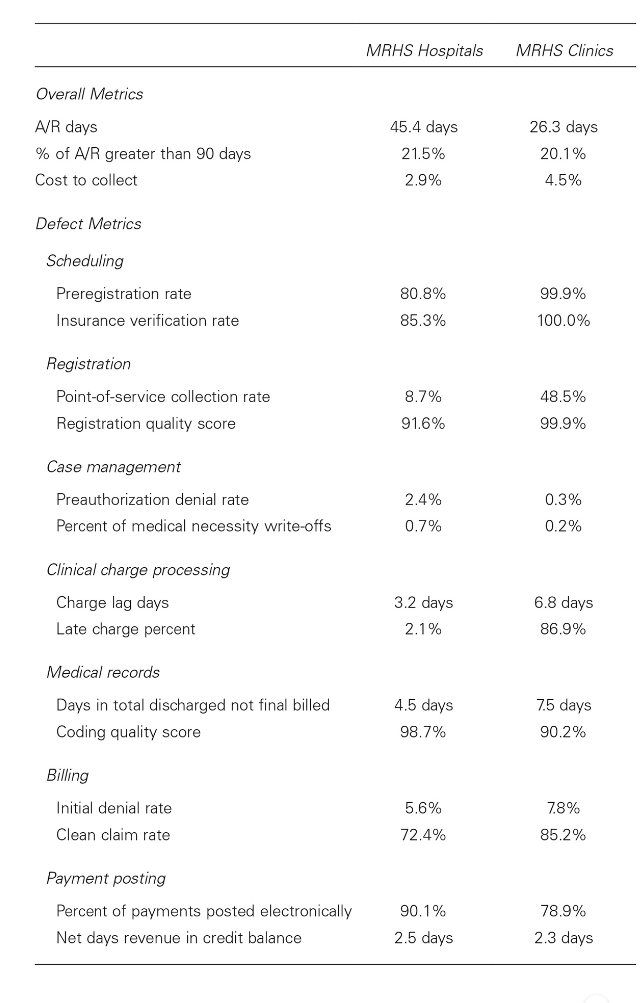
Question: *Using the below template add one additional overall benchmark and one defect benchmark for each of the revenue cycle functions listed. ( Gapenski CASE #30

*Using the below template add one additional overall benchmark and one defect benchmark for each of the revenue cycle functions listed. ( Gapenski CASE #30 MILWAUKEE REGIONAL HEALTH SYSTEM 7th edition )

*Using the below template add one additional*Using the below template add one additional*Using the below template add one additional*Using the below template add one additional
Metric Hospital Clinic Metric Definition Benchmark Benchmark Overall Metrics A/R days Net patient accounts 48.3 days 28.5 days receivable/(Annual patient service revenue/365 days) Defect Metrics Scheduling Registration Case management Clinical charge processing Medical records Billing Payment postingHospital Clinic Metric Definition Benchmark Benchmark Overall Metrics A/R days Net patient accounts receivable/ 48.3 days 28.5 days (Annual net patient revenue/365 days) Percent of A/R greater Accounts receivable aged greater than 29.6% 19.0% than 90 days 90 days/Total accounts receivable Cost to collect Total revenue cycle costs/ 3.5% 4.2% Total cash collected Defect Metrics Scheduling Preregistration rate No. of patient encounters preregistered/ 84.8% 99.1% No. of scheduled patient encounters Insurance verification No. of verified encounters/ 90.0% 98.7% rate No. of registered encounters Registration Point-of-service Point-of-service cash collections/ 13.4% 36.2% collection rate Total patient cash collected Registration quality No. of correct patient demographic and 98.7% 99.4% score insurance data elements input/ Total data elements required at registration Case management Preauthorization denial No. of claims denied for no preauthorization/ 1.8% 0.7% rate No. of claims submittedPercent of medical Medical necessity write-offs/Total charges 0.4% 0.6% necessity write-offs Clinical charge processing Charge lag days Days between service date and posting of 3.6 days 5.1 days charge/Encounters billed Late charge % Charges posted more than 3 days after the 8.4% 78.6% date of service/Total charges Medical records Days in total discharged Gross dollars in accounts receivable 7.4 days 5.9 days not final billed unbilled/(Annual net patient revenue/ 365 days) Coding quality score No. of correct coding data elements input/ 96.5% 93.2% Total data elements required at coding Billing Initial denial rate No. of claims denied/No. of claims 4.9% 8.2% submitted Clean claim rate No. of claims that pass edits with no 76.8% 81.2% manual intervention/Total billed claims Payment posting Percent of payments Dollars posted electronically/ 86.7% 83.1% posted electronically Total payments posted Net days revenue in Dollars in credit balance/ 1.9 days 3.2 days credit balance (Annual net patient revenue/365 days) Credit balance reflects monies owed to payers because of improper billing.MRHS Hospitals MRHS Clinics Overall Metrics A/R days 45.4 days 26.3 days % of A/R greater than 90 days 21.5% 20.1% Cost to collect 2.9% 4.5% Defect Metrics Scheduling Preregistration rate 80.8% 99.9% Insurance verification rate 85.3% 100.0% Registration Point-of-service collection rate 8.7% 48.5% Registration quality score 91.6% 99.9% Case management Preauthorization denial rate 2.4% 0.3% Percent of medical necessity write-offs 0.7% 0.2% Clinical charge processing Charge lag days 3.2 days 6.8 days Late charge percent 2.1% 86.9% Medical records Days in total discharged not final billed 4.5 days 7.5 days Coding quality score 98.7% 90.2% Billing Initial denial rate 5.6% 7.8% Clean claim rate 72.4% 85.2% Payment posting Percent of payments posted electronically 90.1% 78.9% Net days revenue in credit balance 2.5 days 2.3 days

Step by Step Solution

There are 3 Steps involved in it

1 Expert Approved Answer
Step: 1 Unlock blur-text-image
Question Has Been Solved by an Expert!

Get step-by-step solutions from verified subject matter experts

Step: 2 Unlock
Step: 3 Unlock

Students Have Also Explored These Related Finance Questions!