

Question: Using the Benford distribution to analyze the Benford Excel data, which digit deviates the most from the expected distribution? First Digit Probability begin{tabular}{|c|c|} hline 1
Using the Benford distribution to analyze the Benford Excel data, which digit deviates the most from the expected distribution?
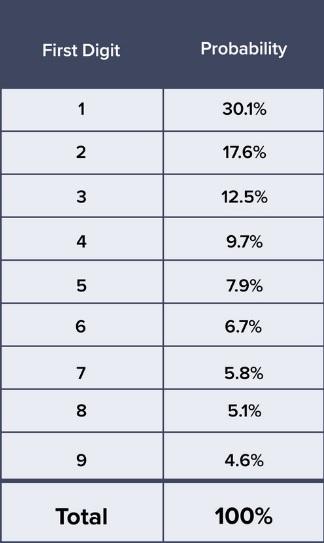
First Digit Probability \begin{tabular}{|c|c|} \hline 1 & 30.1% \\ \hline 2 & 17.6% \\ \hline 3 & 12.5% \\ \hline 4 & 9.7% \\ \hline 5 & 7.9% \\ \hline 6 & 6.7% \\ \hline 7 & 5.8% \\ \hline 8 & 5.1% \\ \hline 9 & 4.6% \\ \hline Total & 100% \\ \hline \end{tabular}
Step by Step Solution
There are 3 Steps involved in it
1 Expert Approved Answer
Step: 1 Unlock

Question Has Been Solved by an Expert!
Get step-by-step solutions from verified subject matter experts
Step: 2 Unlock
Step: 3 Unlock