

Question: Using the box plots given below, based on three distributions, A, B, C, identify the statement that is FALSE. 0.60 6.03 0.11 0.1.1 0.37 10.50
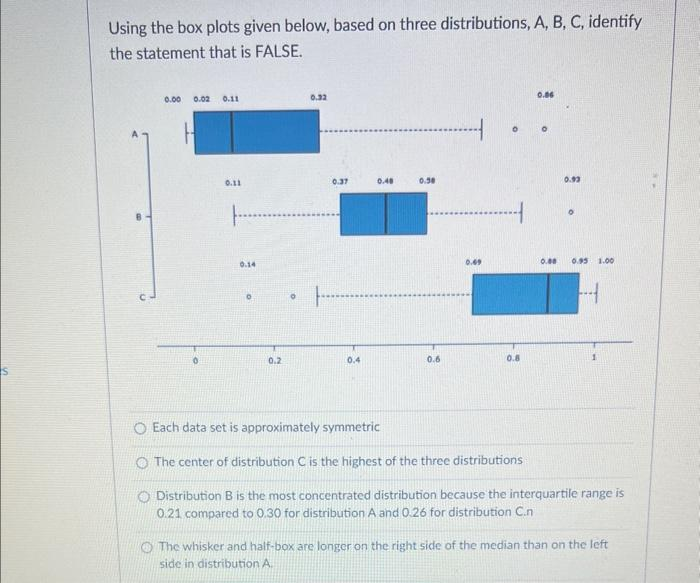
Using the box plots given below, based on three distributions, A, B, C, identify the statement that is FALSE. 0.60 6.03 0.11 0.1.1 0.37 10.50 0.13 0.14 0.1 0.05. 1.00 0.2 0.4 0.6 0.8 Each data set is approximately symmetric The center of distribution C is the highest of the three distributions Distribution B is the most concentrated distribution because the interquartile range is 0.21 compared to 0.30 for distribution A and 0.26 for distribution C.n The whisker and half-box are longer on the right side of the median than on the left side in distribution A
Step by Step Solution
There are 3 Steps involved in it
1 Expert Approved Answer
Step: 1 Unlock

Question Has Been Solved by an Expert!
Get step-by-step solutions from verified subject matter experts
Step: 2 Unlock
Step: 3 Unlock