

Question: Using the budget project you just completed, create a PowerPoint or Word Document presentation that will serve as an executive brief to the organization's leadership
Using the budget project you just completed, create a PowerPoint or Word Document presentation that will serve as an executive brief to the organization's leadership team. The presentation should include an overview of the budgets and the process for creating the budgets.
1. Briefly summarize each department budget and note any large variances. 2. Explain two variances that might cause concern or prompt further analysis. 3. Create an executive briefing presentation in which you briefly summarize all budgets. Include all supporting documentation as addendums to the brief.
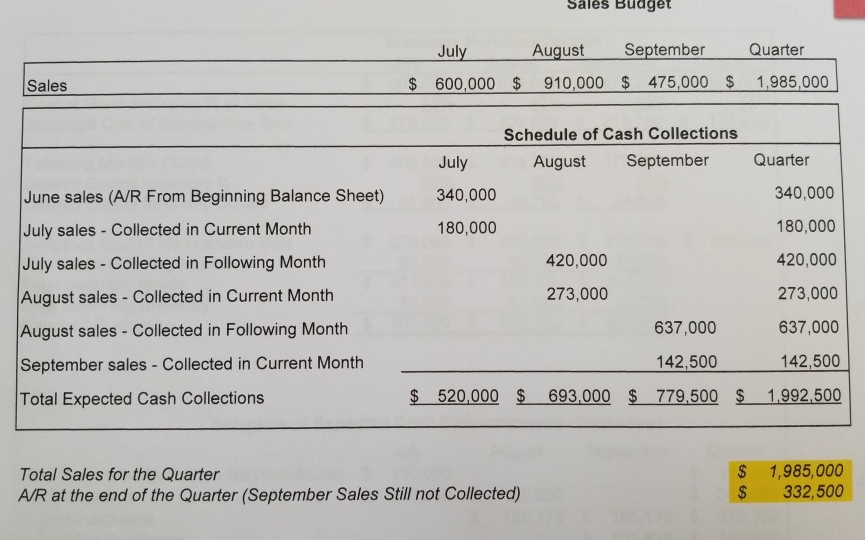
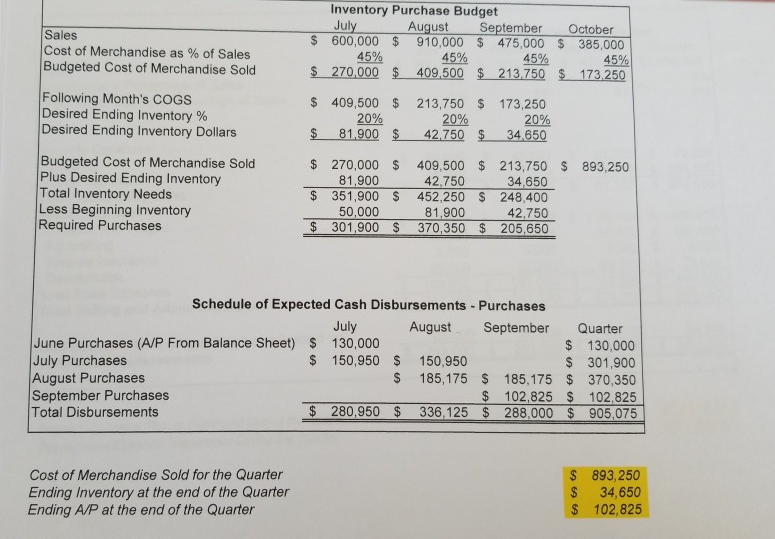
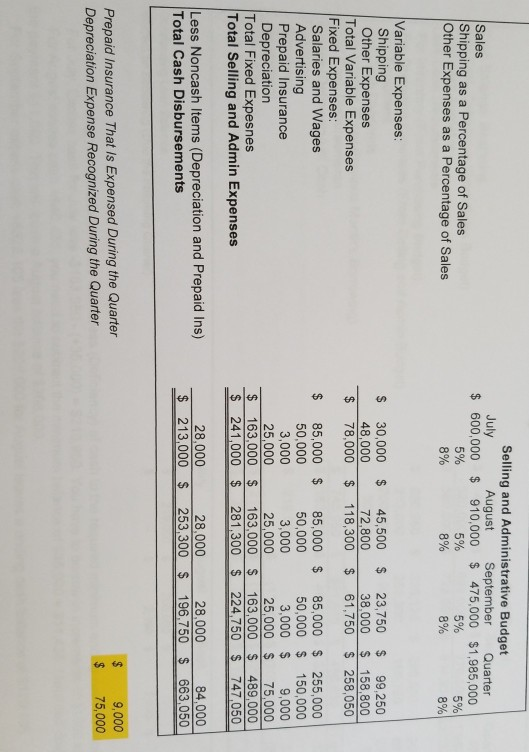
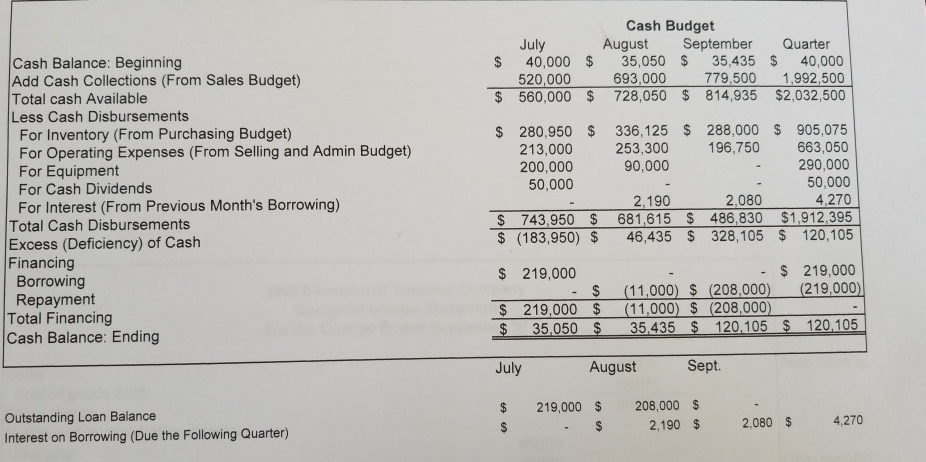
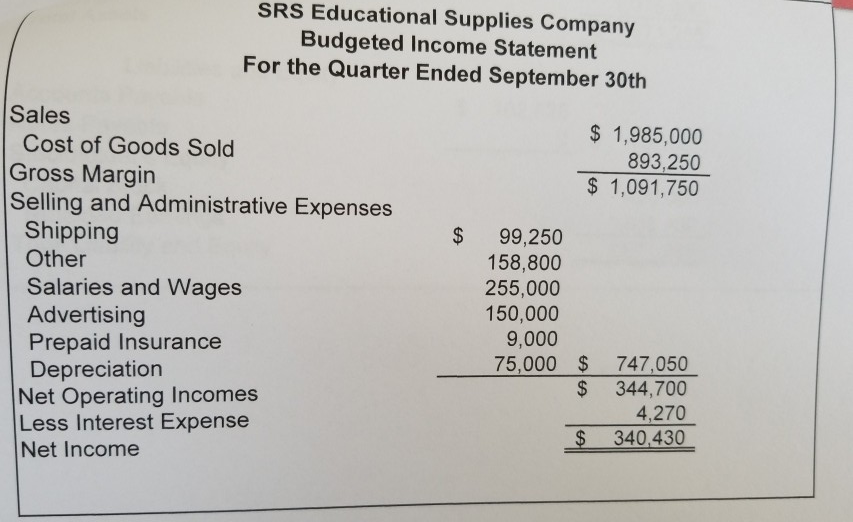
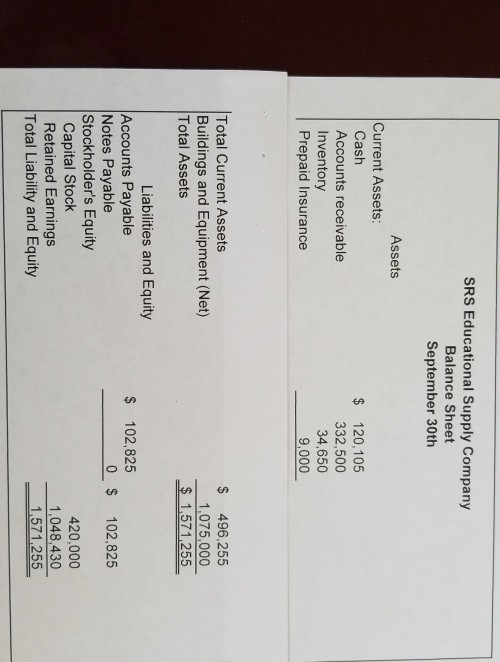
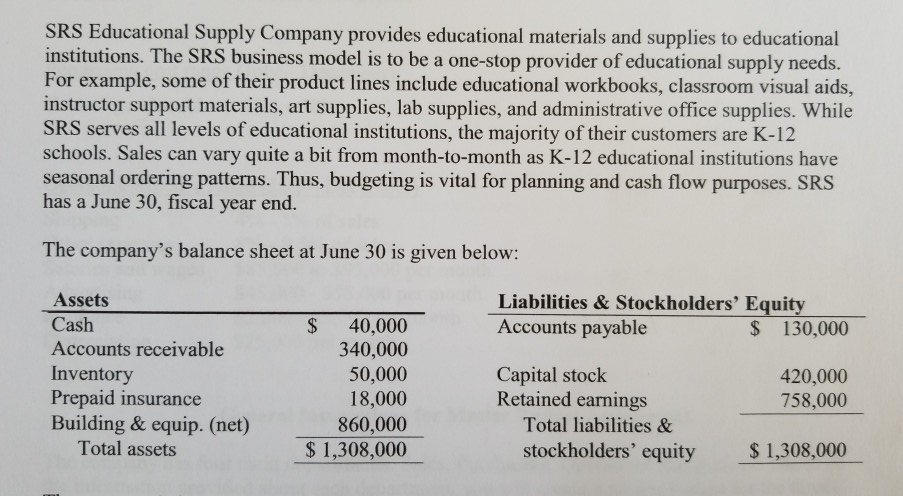
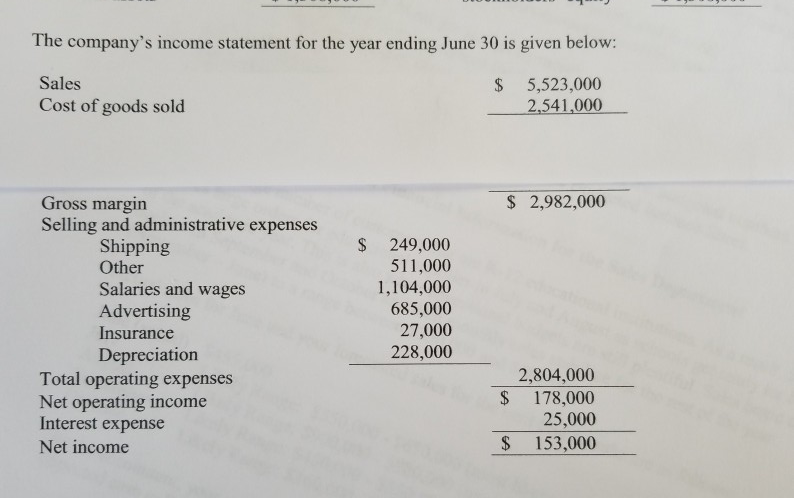
Sales Budget September Quarter July August 1,985,000 $ 600,000 $ 910,000 $ 475,000 $ Sales Schedule of Cash Collections Quarter September July August June sales (A/R From Beginning Balance Sheet) 340,000 340,000 180,000 180,000 July sales Collected in Current Month 420,000 July sales - Collected in Following Month 420,000 273,000 273,000 August sales- Collected in Current Month 637,000 637,000 August sales -Collected in Following Month 142,500 142,500 September sales -Collected in Current Month 693.000 $ 779,500 $ 520,000 $ 1,992,500 Total Expected Cash Collections 1,985,000 332,500 $ Total Sales for the Quarter A/R at the end of the Quarter (September Sales Still not Collected) Inventory Purchase Budget August 910,000 45% $ 270,000 $ 409,500 $ 213,750 $ July $ 600,000 45% September 475,000 October 385,000 Sales Cost of Merchandise as % of Sales Budgeted Cost of Merchandise Sold 45% 45% 173,250 Following Month's COGS Desired Ending Inventory % Desired Ending Inventory Dollars 409,500 $ 20% 81,900 $ 213,750 20% 42,750 $ 173,250 20% 34,650 Budgeted Cost of Merchandise Sold Plus Desired Ending Inventory Total Inventory Needs Less Beginning Inventory Required Purchases $ 270,000 $ 81,900 $ 351,900 S 409,500 $ 213,750 $ 34,650 893,250 42,750 452,250 $ 248.400 50,000 81,900 370,350 $ 42,750 205,650 $ 301,900 $ Schedule of Expected Cash Disbursements - Purchases July August September Quarter June Purchases (A/P From Balance Sheet) 130,000 July Purchases August Purchases September Purchases Total Disbursements $130,000 $ 301,900 185,175 370,350 $ 102,825 $ 102,825 336,125 $ 288,000 $ 905,075 150,950 $ 150,950 $ 185,175 $ 280,950 $ Cost of Merchandise Sold for the Quarter Ending Inventory at the end of the Quarter Ending A/P at the end of the Quarter $ 893,250 34,650 102,825 EA EA Selling and Administrative Budget July 600,000 $ August 910,000 September $ 475,000 $1,985,000 Quarter Sales Shipping as a Percentage of Sales Other Expenses as a Percentage of Sales 5% 5% 5% 8% 5% 8% 8% 8% Variable Expenses: Shipping Other Expenses Total Variable Expenses Fixed Expenses: Salaries and Wages Advertising Prepaid Insurance Depreciation Total Fixed Expesnes Total Selling and Admin Expenses 23,750 38,000 $ $ 30,000 48,000 $ 45,500 72,800 $ 99,250 $ 158,800 $ 258,050 78,000 118,300 61,750 85,000 $ 255,000 50,000 $ 3,000 $ 25,000 $ 163,000 163,000 489,000 281,300 $ 224,750 747,050 $ 85,000 50,000 85,000 50,000 150,000 9,000 3,000 3,000 25,000 25,000 75,000 $ 163,000 $ 241,000 $ Less Noncash Items (Depreciation and Prepaid Ins) Total Cash Disbursements 28,000 253,300 $ 196,750 $ 663,050 28,000 28,000 84,000 213,000 $ 9,000 Prepaid Insurance That Is Expensed During the Quarter Depreciation Expense Recognized During the Quarter 75,000 Cash Budget August 35,050 $ 693,000 September 35,435 Quarter July 40,000 $ 520,000 $ 560,000 $ 728,050 $ 814,935 $2,032,500 Cash Balance: Beginning Add Cash Collections (From Sales Budget) Total cash Available Less Cash Disbursements For Inventory (From Purchasing Budget) For Operating Expenses (From Selling and Admin Budget) For Equipment For Cash Dividends 40,000 1,992,500 779,500 $ 280,950 $ 213,000 200,000 50,000 336,125 288,000 $ 905,075 663,050 290,000 50,000 4,270 253,300 90,000 196,750 2,190 681,615 $ 486,830 $1,912,395 46,435 $ 328,105 120,105 2,080 For Interest (From Previous Month's Borrowing) Total Cash Disbursements Excess (Deficiency) of Cash Financing Borrowing Repayment Total Financing Cash Balance: Ending $ 743,950 $ $ (183,950) $ $ 219,000 (219,000) $ 219,000 $ (11,000) $ (208,000) (11,000) $ (208,000) 35,435 $ 120,105 120,105 $ 219,000 $ 35,050 $ $ Sept. July August 208,000 $ 219,000 $ Outstanding Loan Balance Interest on Borrowing (Due the Following Quarter) 4,270 2,080 $ 2,190 $ SRS Educational Supplies Company Budgeted Income Statement For the Quarter Ended September 30th Sales Cost of Goods Sold Gross Margin Selling and Administrative Expenses Shipping Other $1,985,000 893,250 $ 1,091,750 $ 99,250 158,800 255,000 150,000 9,000 75,000 $ $ Salaries and Wages Advertising Prepaid Insurance Depreciation Net Operating Incomes Less Interest Expense Net Income 747,050 344,700 4,270 340,430 $ SRS Educational Supply Company Balance Sheet September 30th Assets Current Assets: Cash $ 120,105 332,500 34,650 Accounts receivable Inventory Prepaid Insurance 9,000 Total Current Assets Buildings and Equipment (Net) Total Assets 496,255 1,075,000 1,571,255 Liabilities and Equity $ 102,825 0 $ Accounts Payable Notes Payable Stockholder's Equity Capital Stock Retained Earnings Total Liability and Equity 102,825 420,000 1,048,430 1,571,255 SRS Educational Supply Company provides educational materials and supplies to educational institutions. The SRS business model is to be a one-stop provider of educational supply needs. For example, some of their product lines include educational workbooks, classroom visual aids, instructor support materials, art supplies, lab supplies, and administrative office supplies. While SRS serves all levels of educational institutions, the majority of their customers are K-12 schools. Sales can vary quite a bit from month-to-month as K-12 educational institutions have seasonal ordering patterns. Thus, budgeting is vital for planning and cash flow purposes. SRS has a June 30, fiscal year end. The company's balance sheet at June 30 is given below: Liabilities &Stockholders' Equity Accounts payable Assets Cash $ 130,000 $ 40,000 Accounts receivable 340,000 Inventory Prepaid insurance Building&equip. (net) Total assets 50,000 18,000 Capital stock Retained earnings Total liabilities & 420,000 758,000 860,000 stockholders' equity $1,308,000 $1,308,000 The company's income statement for the year ending June 30 is given below: Sales 5,523,000 2.541.000 Cost of goods sold Gross margin Selling and administrative expenses Shipping Other Salaries and wages Advertising Insurance 2,982,000 249,000 511,000 1,104,000 685,000 27,000 228,000 Depreciation Total operating expenses Net operating income Interest expense 2,804,000 178,000 25,000 153,000 Net income
Step by Step Solution
There are 3 Steps involved in it

Get step-by-step solutions from verified subject matter experts