

Question: Using the calculations in the spreadsheet write a summary of your findings as if reporting it to the owners of the business, in which you:Define
Using the calculations in the spreadsheet write a summary of your findings as if reporting it to the owners of the business, in which you:Define the descriptive data presented to be understood by the owners of the organization.Identify opportunities for increasing income from the data, andRecommend two changes in nightly special and/or entertainment in an effort to boost sales
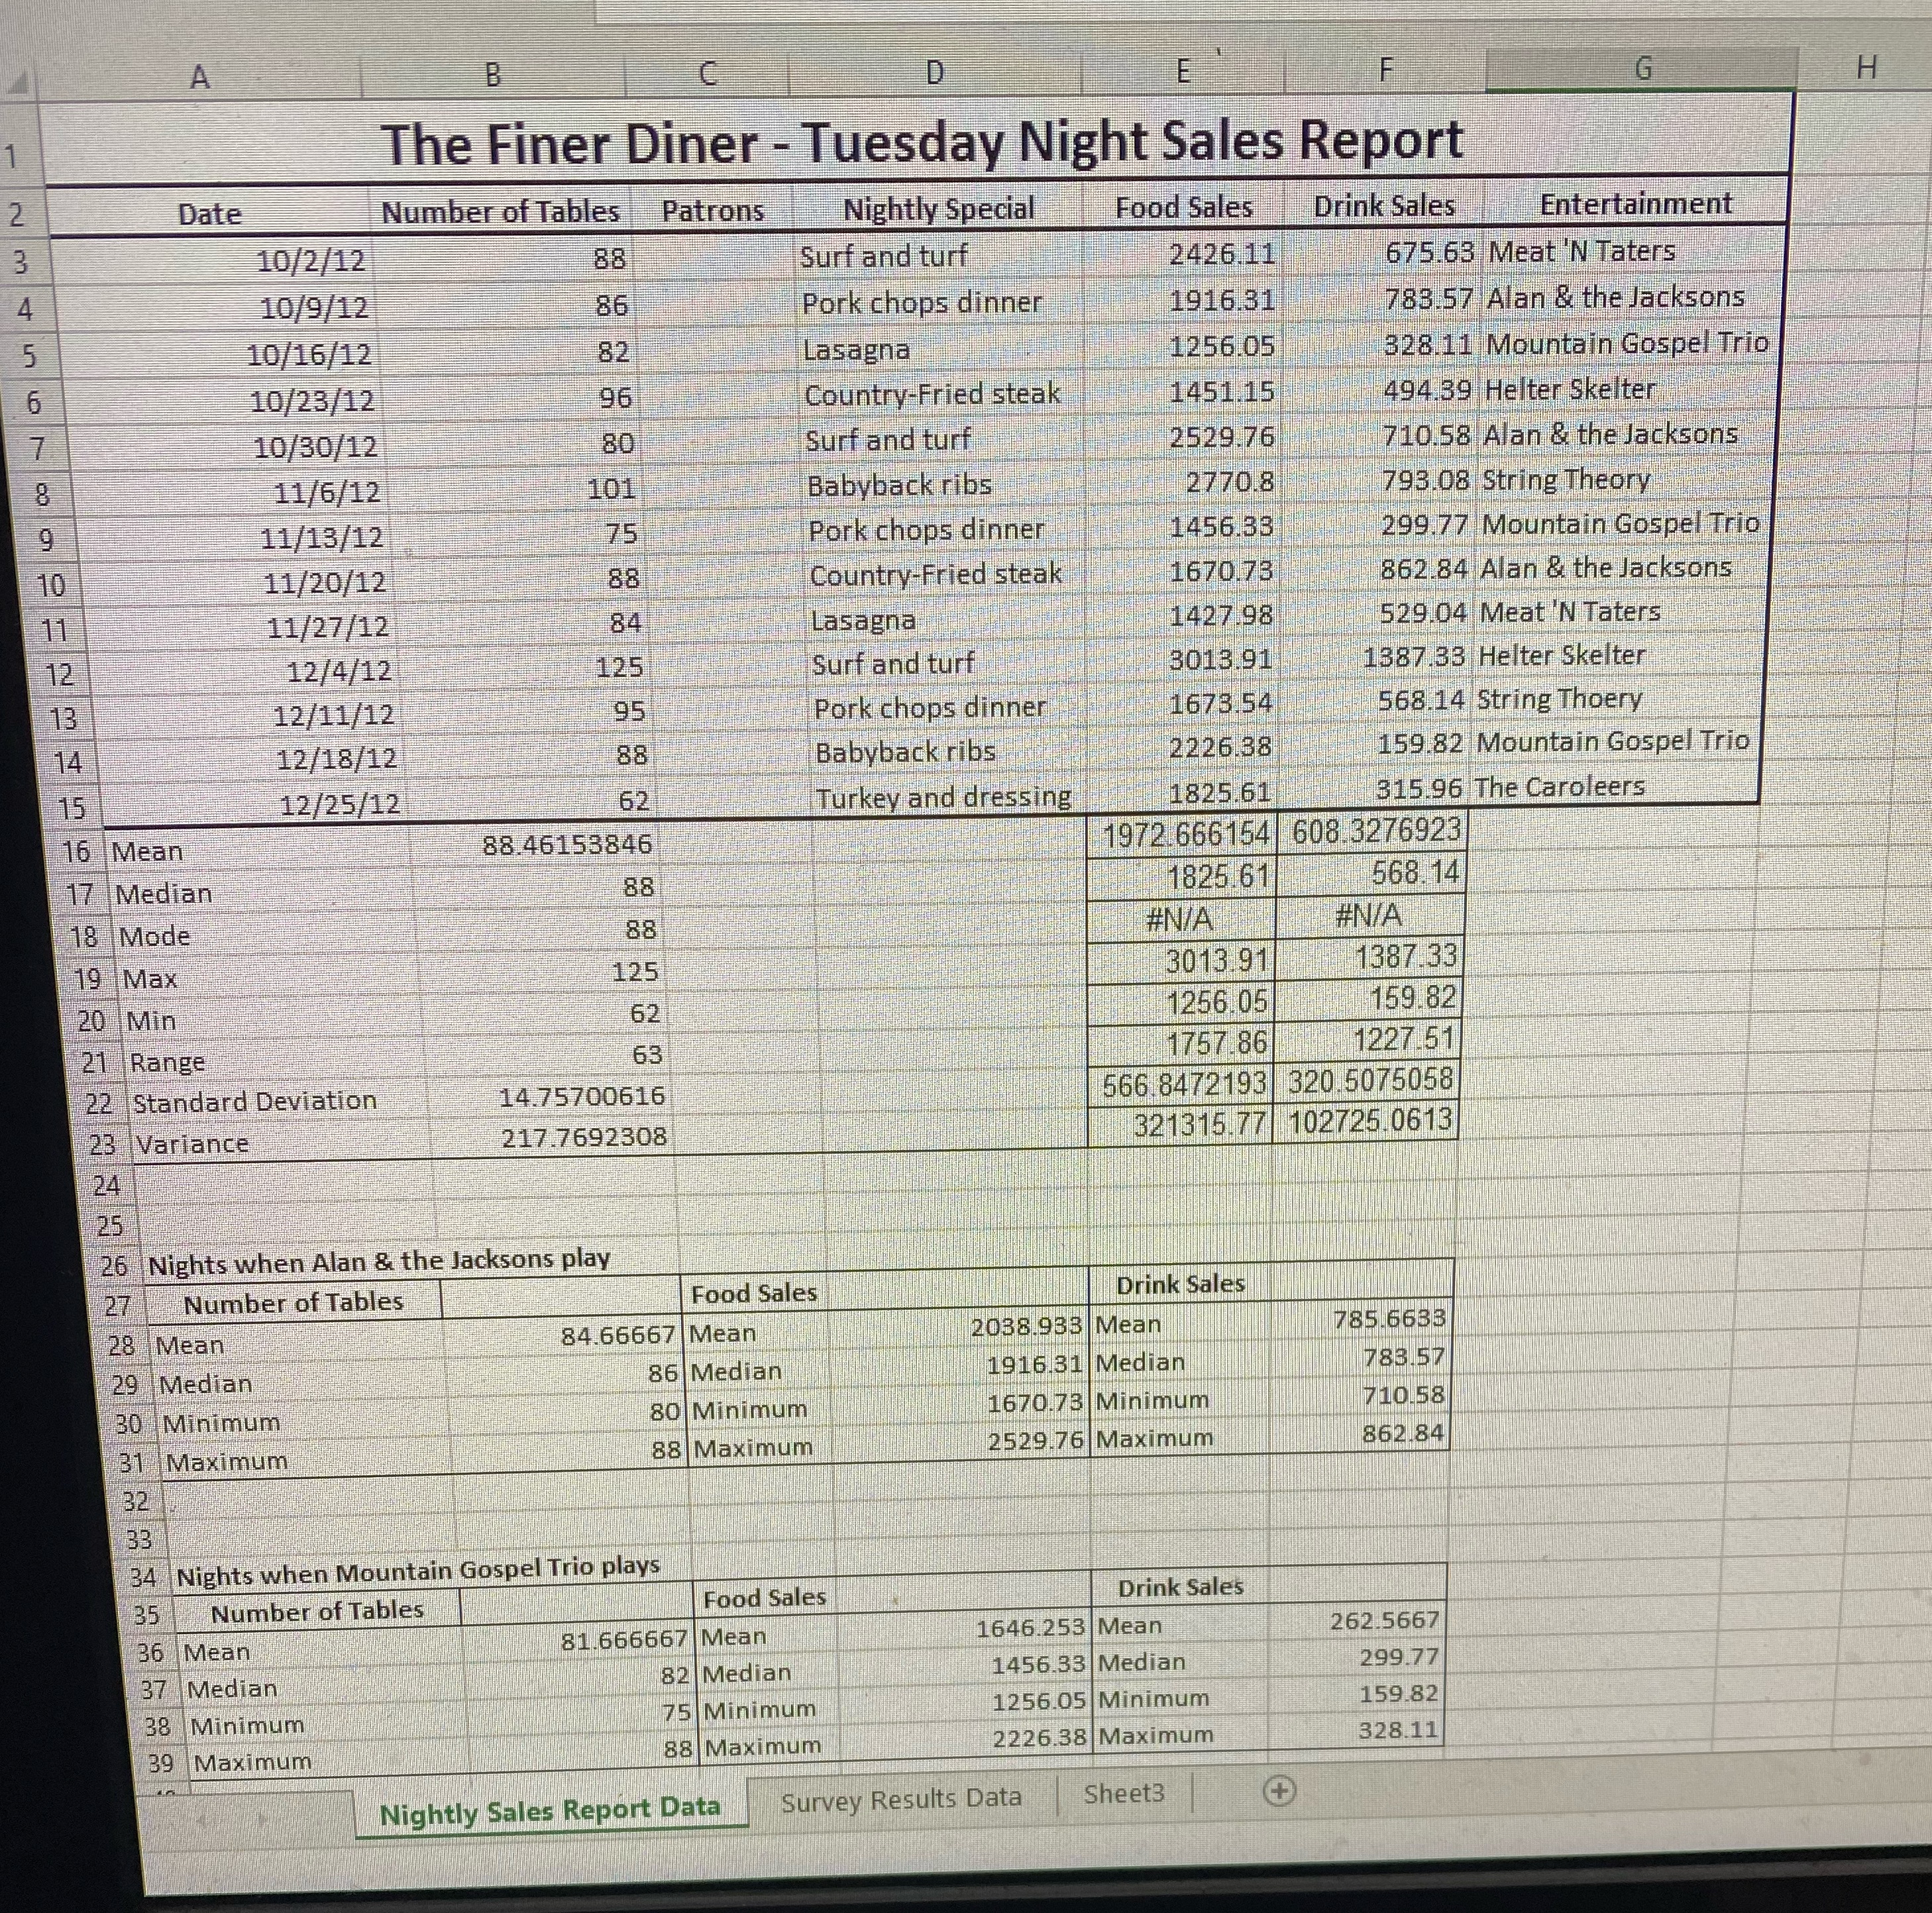
G H The Finer Diner - Tuesday Night Sales Report Date Number of Tables Patrons Nightly Special Food Sales Drink Sales Entertainment 10/2/12 88 Surf and turf 2426.11 675.63 Meat'N Taters 10/9/12 86 Pork chops dinner 1916.31 783.57 Alan & the Jacksons 10/16/12 82 Lasagna 1256.05 328 11 Mountain Gospel T 10/23/12 96 Country-Fried steak 51.15 494 39 Helter Skelter 10/30/12 80 Surf and turf 2529.76 710.58 Alan & the Jacksons 11/6/12 101 Babyback ribs 2770 8 793 08 string Theory 11/13/12 75 Pork chops dinner 1456.35 299.77 Mountain Gospel Trio 10 11/20/12 88 Country-Fried steak 1670.73 862 84 Alan & the Jacksons 11 11/27/12 84 Lasagna 1427.98 529.04 Meat 'N Taters 12 12/4/12 Surf and turf 3013.91 1387 33 Helter Skelter 13 12/11/12 Pork chops dinner 1673.54 14 12/18/12 Babyback ribs 568.14 String Thoery 2226.38 159.82 Mountain Gospel Trio 15 12/25/12 Turkey and dressing 1825.61 315.96 The Caroleers 16 Mean 88.46153846 1972 666154 608 3276923 17 Median 88 1825 61 568 14 18 Mode 88 #N/A #N/A 19 Max 125 3013 91 1387 33 20 Min 62 1256 05 159.82 21 Range 63 1757.86 1227.51 22 Standard Deviation 14.75700616 566 8472193 320.5075058 23 Variance 217.7692308 32 1315.77 102725.0613 -24 26 Nights when Alan & the Jacksons play 27 Number of Tables Food Sales Drink Sales 28 Mean 84.66667 Mean 2038.935 Mean 785.6633 29 Median 86 Median 1916.31 Median 783 57 30 Minimum 80 Minimum 1670.73 Minimum 710 58 31 Maximum 38 Maximum 2529.76 Maximum 862 84 331 34 Nights when Mountain Gospel Trio plays 35 Number of Tables \\Food Sales Drink Sales 36 Mean 81.666667 Mean 1646.253 Mean 262.5667 37 Median 82 Median 1456.33 Median 299.77 38 Minimum 75 Minimum 1256.05 Minimum 159.82 39 Maximum 88 Maximum 2226.38 Maximum 328.11 Nightly Sales Report Data Survey Results Data Sheet3 +
Step by Step Solution
There are 3 Steps involved in it

Get step-by-step solutions from verified subject matter experts