

Question: Using the Case Study data on Relationship Quality and Satisfaction with Supplier (2011 Sweden-US_short labels - no missing data.sav), develop a conceptual model with Satisfaction
Using the Case Study data on Relationship Quality and Satisfaction with Supplier (2011 Sweden-US_short labels - no missing data.sav), develop a conceptual model with Satisfaction as the dependent variable(Y) and at least two independent variables(X). The aim of the study is to determine the factors that affect relationship satisfaction.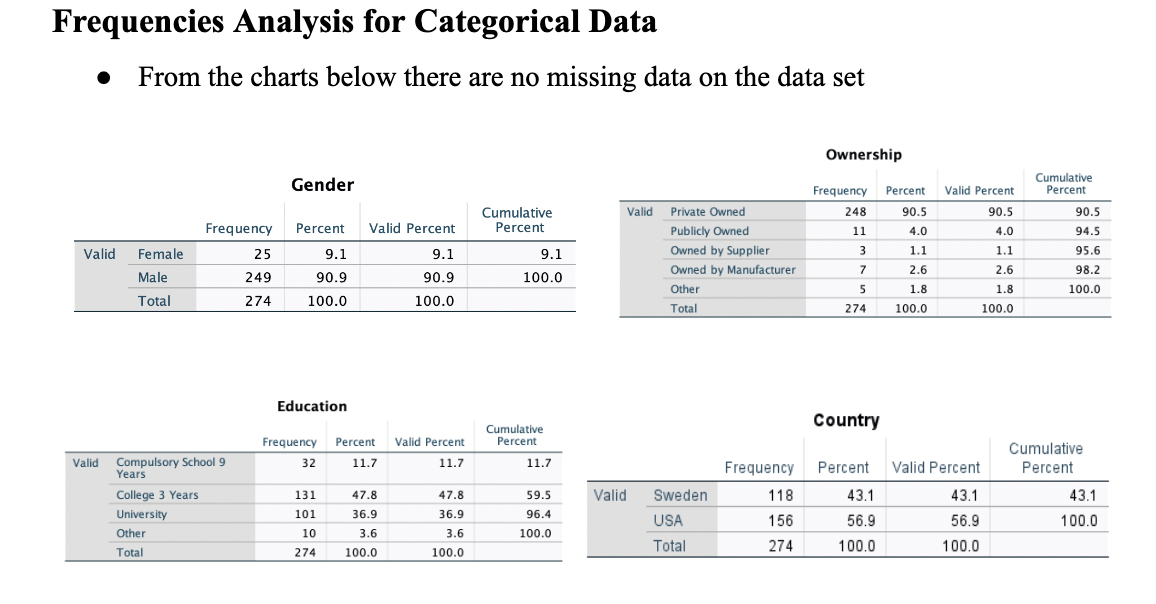
Interpret the above result in few paragraph.
Thank you
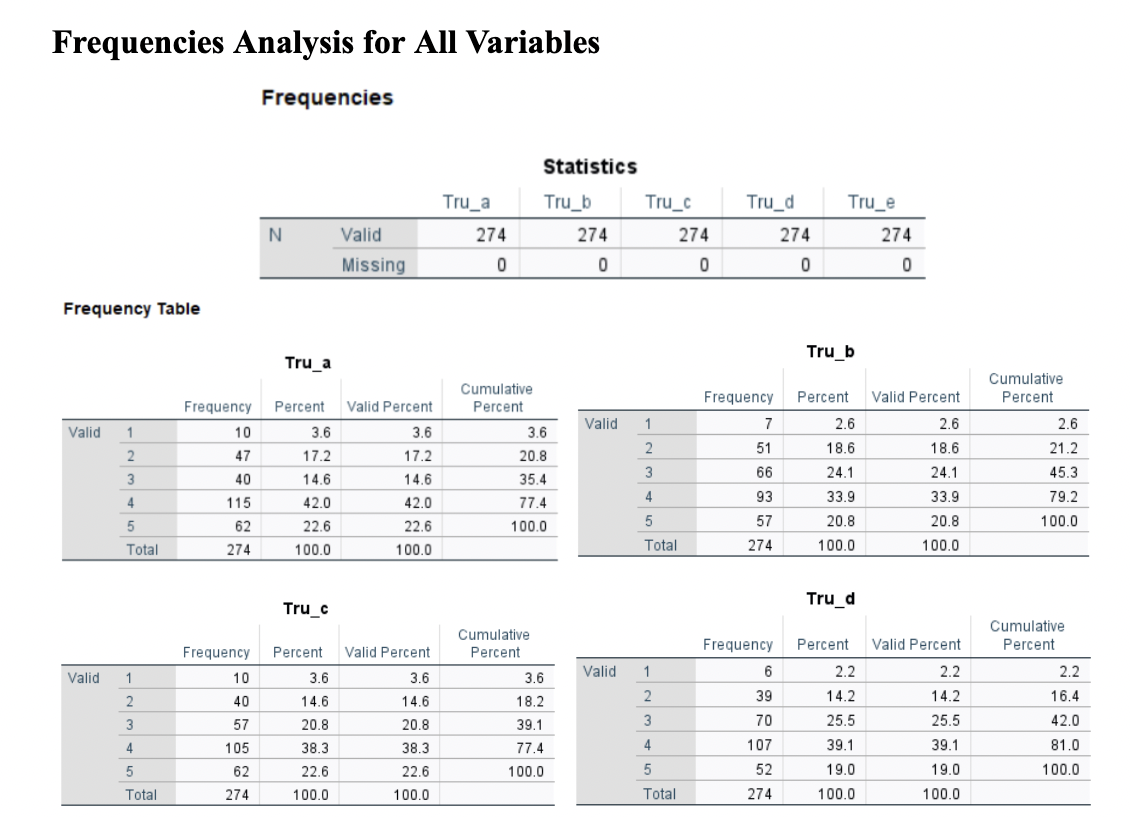
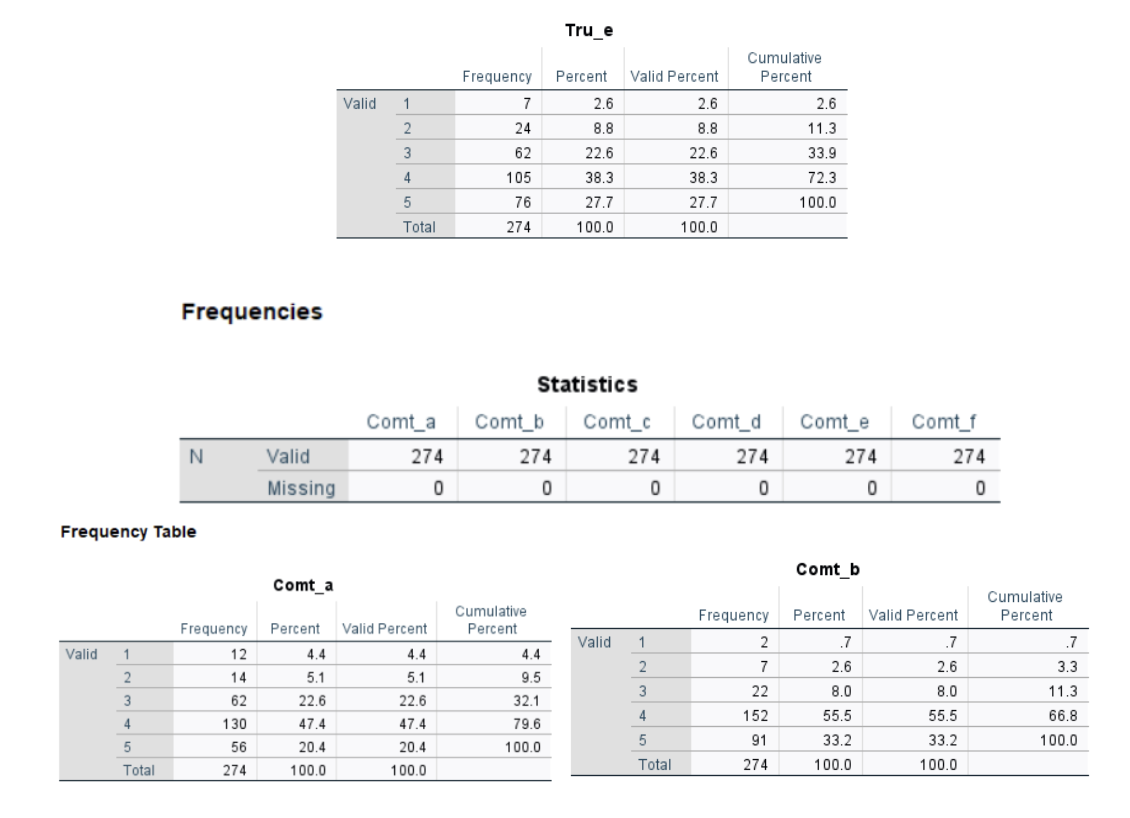
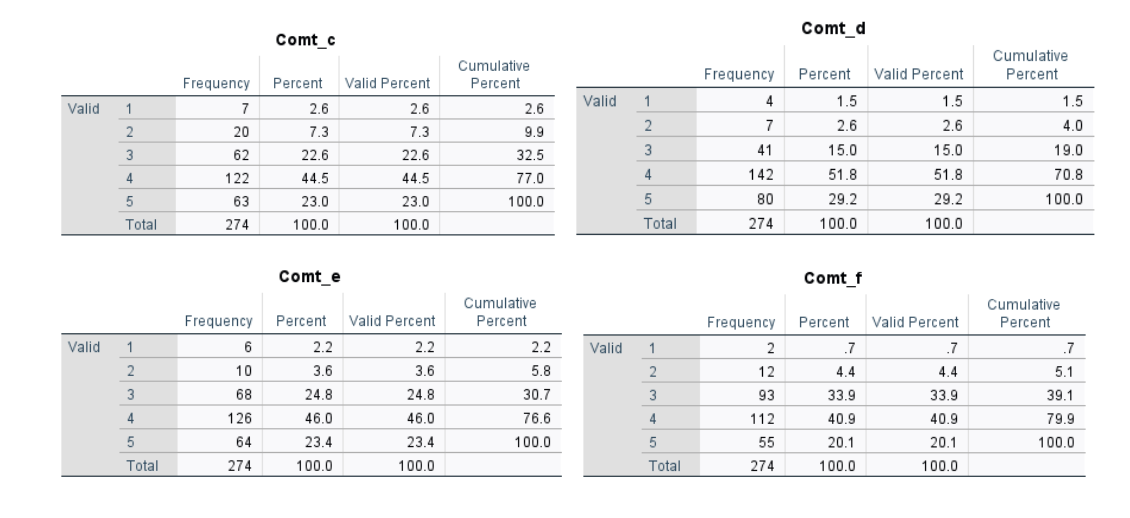
Frequencies Analysis for Categorical Data - From the charts below there are no missing data on the data set Ownership \begin{tabular}{ll|r|r|r|r} & & & & \multicolumn{1}{c}{ Cumulative } \\ & & Frequency & Percent & Valid Percent & \multicolumn{1}{c}{ Percent } \\ \hline \multirow{6}{*}{ Valid } & Private Owned & 248 & 90.5 & 90.5 & 90.5 \\ \cline { 2 - 6 } & Publicly Owned & 11 & 4.0 & 4.0 & 94.5 \\ \hline & Owned by Supplier & 3 & 1.1 & 1.1 & 95.6 \\ \hline & Owned by Manufacturer & 7 & 2.6 & 2.6 & 98.2 \\ \hline & 5 & 1.8 & 1.8 & 100.0 \\ \hline Other & 274 & 100.0 & 100.0 & \\ \hline Total & & & & \\ \hline \end{tabular} Education Country \begin{tabular}{rrr|r|r|r} & & & & & \multicolumn{2}{c}{ Cumulative } \\ & & Frequency & Percent & Valid Percent & \multicolumn{1}{c}{ Percent } \\ \hline \multirow{2}{*}{ Valid } & Sweden & 118 & 43.1 & 43.1 & 43.1 \\ \cline { 2 - 6 } & USA & 156 & 56.9 & 56.9 & 100.0 \\ \cline { 2 - 6 } & Total & 274 & 100.0 & 100.0 & \\ \hline \end{tabular} Frequencies Analysis for All Variables Frequencies Frequency Table Frequencies Statistics Frequency Table
Step by Step Solution
There are 3 Steps involved in it

Get step-by-step solutions from verified subject matter experts