Question: Using the chart below can you please help me answer the question? Thank You! What are two accounts in the Marriott income statement that show
Using the chart below can you please help me answer the question? Thank You!
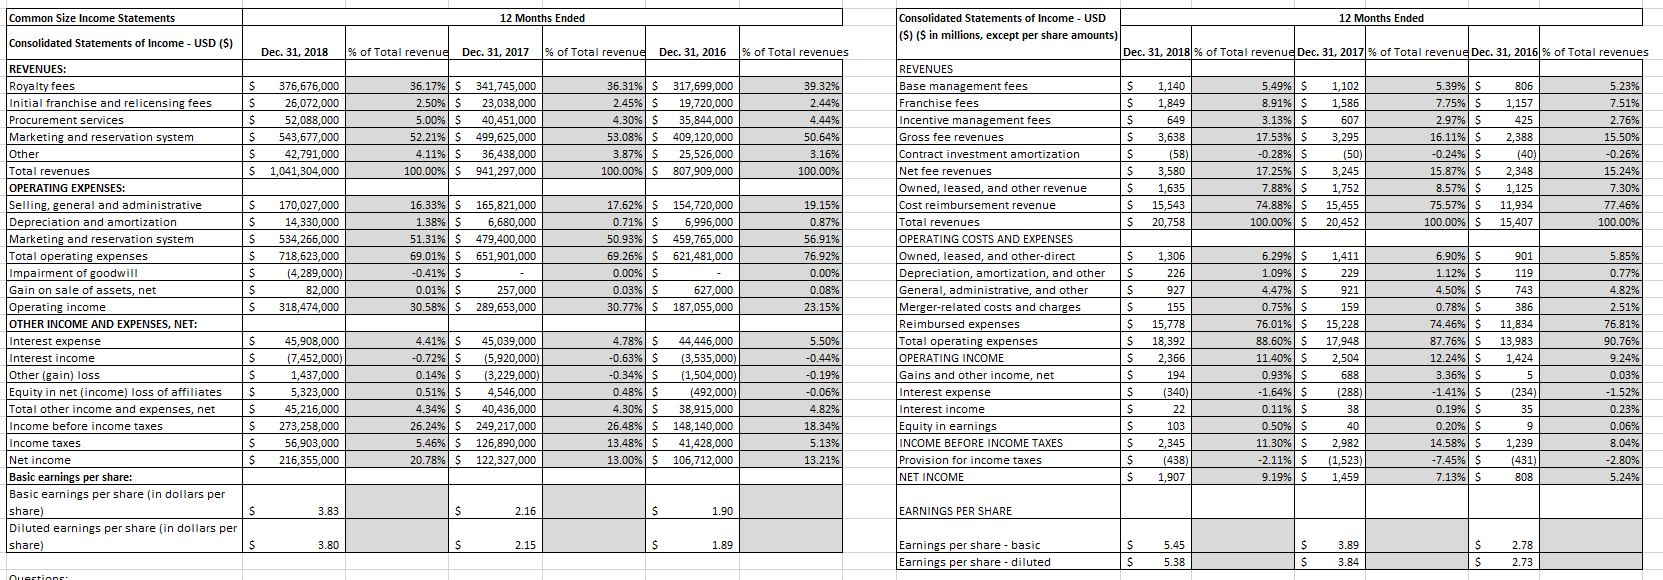
What are two accounts in the Marriott income statement that show the biggest change over the past 3 years? What information in the 10-K report helps to explain these changes?
Common Size Income Statements 12 Months Ended Consolidated Statements of Income - USD ($) Consolidated Statements of Income - USD REVENUES: Dec. 31, 2018 % of Total revenue Dec. 31, 2017 % of Total revenue Dec. 31, 2016 % of Total revenues (S) ($ in millions, except per share amounts) 12 Months Ended Royalty fees 376,676,000 REVENUES Dec. 31, 2018 % of Total revenue Dec. 31, 2017 % of Total revenue Dec. 31, 2016 % of Total revenues Initial franchise and relicensing fees 36.17% $ 341,745,000 26,072,000 36.31% $ 317,699,000 23,038,000 39.32% 2.45% S Base management fees 2.449 1,140 52,088,000 5.00% $ 40,451,000 806 1,586 5.23% Marketing and reservation system 543,677,000 499,625,000 35,844,000 4.44% 409,120,000 Incentive management fees 50.64% 649 7.51% Total revenues 42,791,000 607 S 25,526,000 OPERATING EXPENSES 1,041,304,000 36,438,000 3.638 425 3,295 2.76% 100.00% | $ 941,297,000 2,388 15.50% 100.00% $ 3.16% 807,909,000 Contract investment amortization 100.00% Net fee revenue (58) (50) 3,580 $ 3,245 -0.26% Selling, general and administrative 170,027,000 2,348 15.24% 14,330,000 165,821,000 7.62% $ 154,720,000 Owned, leased, and other revenue 1,635 Cost reimbursement revenue 7.88% S 3.57% S 1,125 7.30% S 1.38% $ 6,680,000 15,543 534,266,000 51.31% $ 0.71% $ 6,996,000 74.88% S 15,455 75.57% $ S 718,623,000 479,400,000 11,934 50.93% $ 0.87% 77.46% 69.01% $ 651,901,000 459,765,000 20,758 59.26% $ 56.91% 621,481,000 OPERATING COSTS AND EXPENSES 100.00%| $ 20,452 100.00% | $ 15,407 100.00% Impairment of goodwill S Gain on sale of assets, net (4,289,000) 0.41% $ 76.92% 0.00% 6.29% $ 5.90% | $ 901 Operating income 0.01% $ 226 318,474,000 257,000 627,000 Depreciation, amortization, and other 30.77% $ 187,055,000 23.15% General, administrative, and other 229 119 0.77% OTHER INCOME AND EXPENSES, NET: 80.58% $ 289,653,000 927 Merger-related costs and charges 921 159 743 4.82% Interest expense 155 45,908,000 Interest income 4.41% $ 45,039,000 1.78% $ 44,446,000 Reimbursed expenses 0.75% 5.50% 5,778 76.01% S 15,228 386 74.46% | $ 2.51% (7,452,000) 0.72% $ (5,920,000) 11,834 0.14% S 0.63% $ 76.81% Other (gain) loss 1,437,000 (3,229,000) 3,535,000 Total operating expenses -0.44% OPERATING INCOME 18,392 17,948 87.76% $ 13,983 90.76% Equity in net (income) loss of affiliates Total other income and expenses, net 5,323,000 0.34% $ 11.40% $ 0.51% $ 4,546,000 1,504,000 0.48% $ 0.19% (492,000) Gains and other income, net 0.06% 194 12.24% $ 1,424 45,216,000 4.30% $ Interest expense 688 9.24% Income before income taxes 4.34% $ 40,436,000 38,915,000 4.82% S 0.93% $ (340) 3.36% $ 73,258,000 6.24% S (288) 0.03% 249,217,000 Interest income Income taxes 22 56,903,000 16.48% $ 18.34% 0.11% $ 38 (234) Net income 5.46% $ 126,890,000 13.48% $ 41,428,000 Equity in earnings 5.13% S 103 0.19% $ 35 0.23% Basic earnings per share: 216,355,000 20.78% $ 122,327,000 13.00% $ 106,712,000 0.06% 13.21% INCOME BEFORE INCOME TAXES 2,345 Provision for income taxes 11.30% $ 2,982 (438 -2.11% S 14.58% S 1,239 7.45% $ 8.04% Basic earnings per share (in dollars per NET INCOME S 1,907 9.19% S 431) 7.13% S 2.80% 808 5.24% Diluted earnings per sha 3.83 per share (in dollars per $ 2.16 S 1.90 EARNINGS PER SHARE [share) 3.80 2.15 S 1.89 Earnings per share - basic 5.45 Earnings per share - diluted 3.89 5.38 2.78 3.84 2.73