

Question: Using the chart below, what percentage did room nights increase from 2012 to 2013? 299% 6.73% 8.82% 11.76% Using a trend analysis from the data
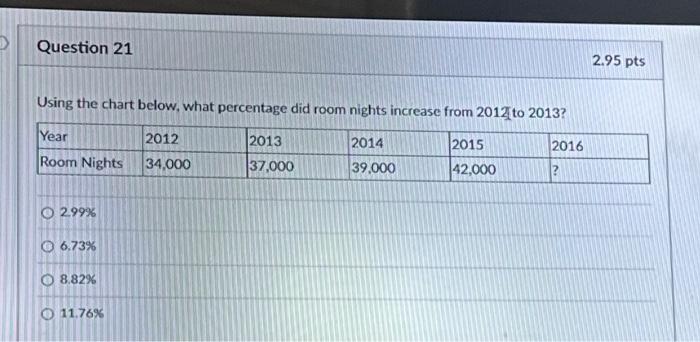
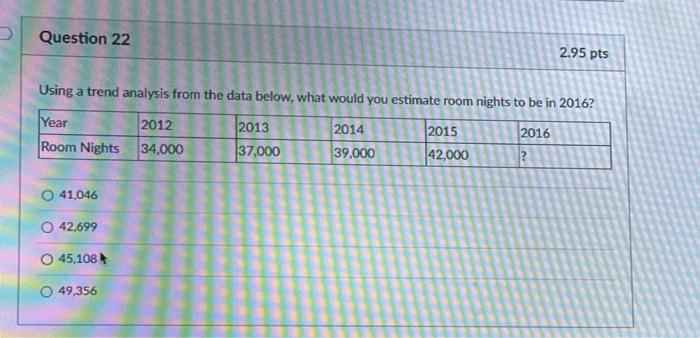
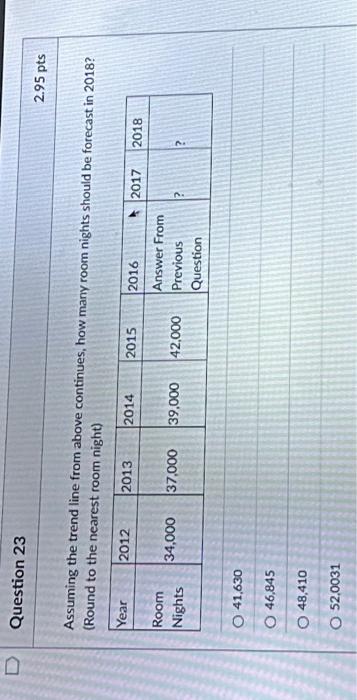
Using the chart below, what percentage did room nights increase from 2012 to 2013? 299% 6.73% 8.82% 11.76% Using a trend analysis from the data below, what would you estimate room nights to be in 2016 ? 41,046 42,699 45,108 t 49,356 Question 23 2.95pts Assuming the trend line from above continues, how many room nights should be forecast in 2018 ? (Round to the nearest room night) 41,630 46,845 48,410 52,0031
Step by Step Solution
There are 3 Steps involved in it
1 Expert Approved Answer
Step: 1 Unlock

Question Has Been Solved by an Expert!
Get step-by-step solutions from verified subject matter experts
Step: 2 Unlock
Step: 3 Unlock