

Question: Using the chart, find: 1-Estimate the variable cost 2-Contribution margin per unit 3.Fixed cost. 4-Breaking-even point per unit. 5.Profit 6-The margin of safety. Contribution Chart
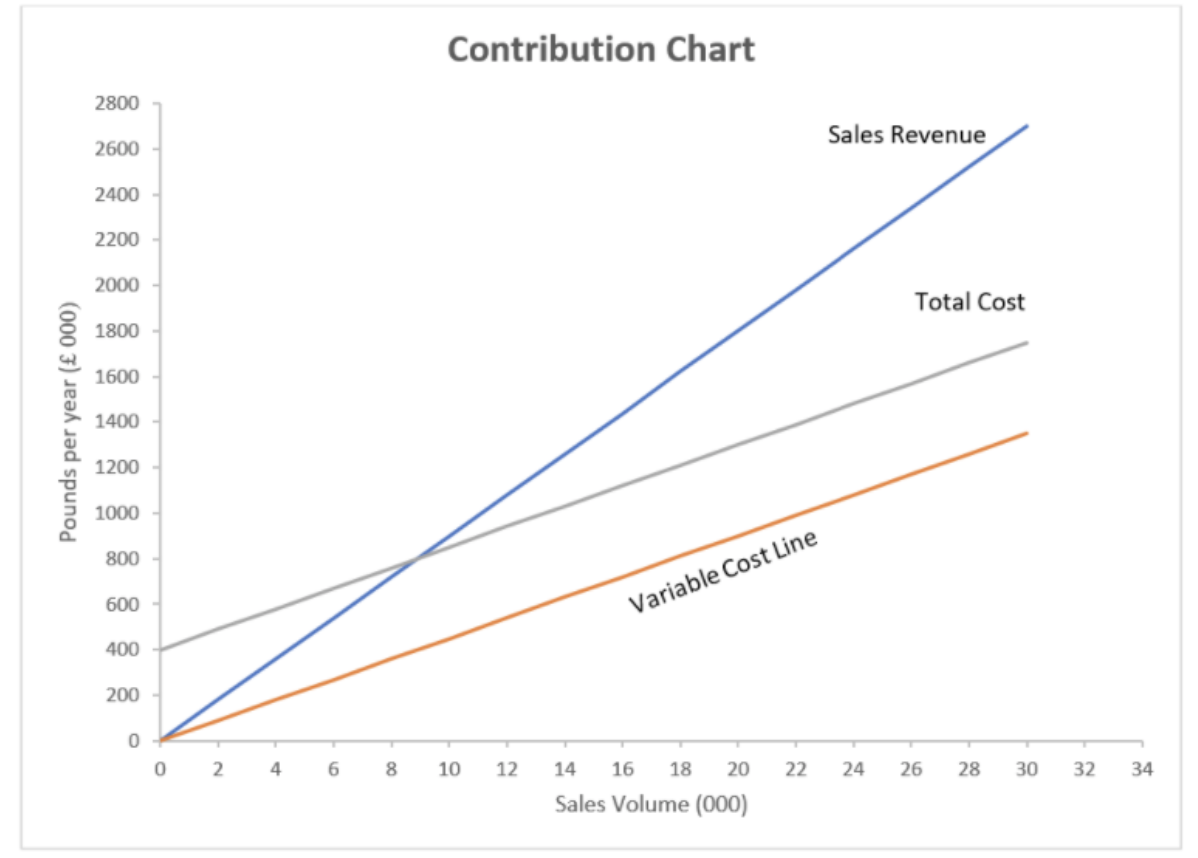 Using the chart, find: 1-Estimate the variable cost 2-Contribution margin per unit 3.Fixed cost. 4-Breaking-even point per unit. 5.Profit 6-The margin of safety.
Contribution Chart 2800 Sales Revenue 2600 2400 2200 2000 Total Cost 1800 1600 Pounds per year ( 000) 1400 1200 1000 800 600 Variable Cost Line 400 200 0 0 2. 4 6 8 10 12 14 16 18 20 22 24 26 28 30 32 34 Sales Volume (000)
Step by Step Solution
There are 3 Steps involved in it
1 Expert Approved Answer
Step: 1 Unlock

Question Has Been Solved by an Expert!
Get step-by-step solutions from verified subject matter experts
Step: 2 Unlock
Step: 3 Unlock