

Question: Using the Collected and Calculated Data in the table below and the stress - strain diagram obtained for a metal specimen in the lab as
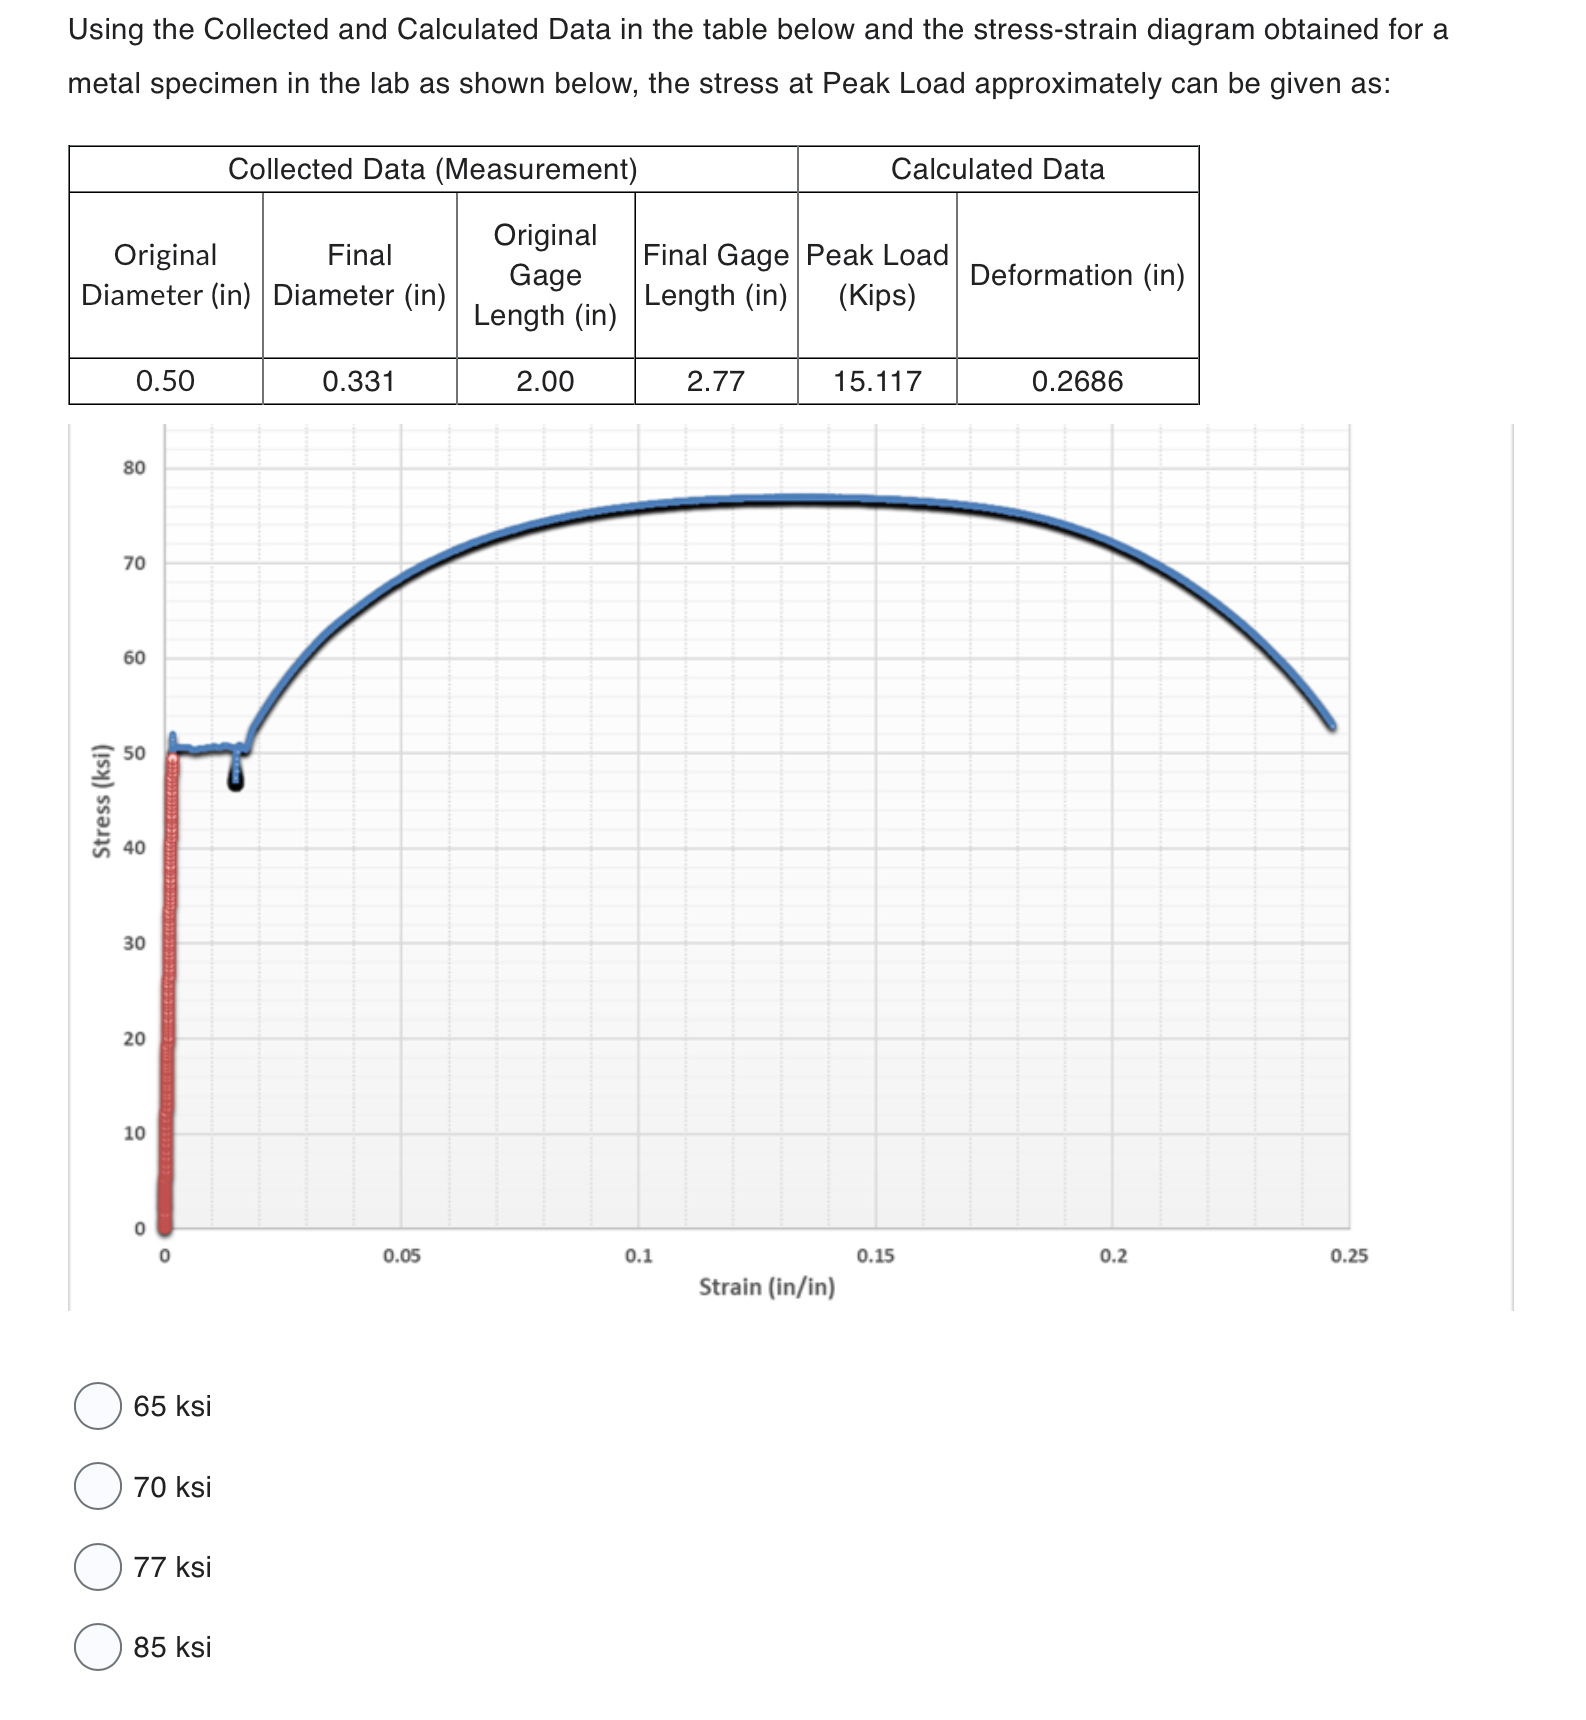
Using the Collected and Calculated Data in the table below and the stressstrain diagram obtained for a metal specimen in the lab as shown below, the stress at Peak Load approximately can be given as:
tableCollected Data MeasurementCalculated DatatableOriginalDiameter intableFinalDiameter intableOriginalGageLength intableFinal GageLength intablePeak LoadKipsDeformation in
ksi
ksi
ksi
ksi
Step by Step Solution
There are 3 Steps involved in it
1 Expert Approved Answer
Step: 1 Unlock

Question Has Been Solved by an Expert!
Get step-by-step solutions from verified subject matter experts
Step: 2 Unlock
Step: 3 Unlock