

Question: Using the data above to create a pivot table by using Excel. Show the percentage of each status of task that totalling to 100%. Insert
Using the data above to create a pivot table by using Excel. Show the percentage of each status of task that totalling to 100%. Insert data labels in percentage. 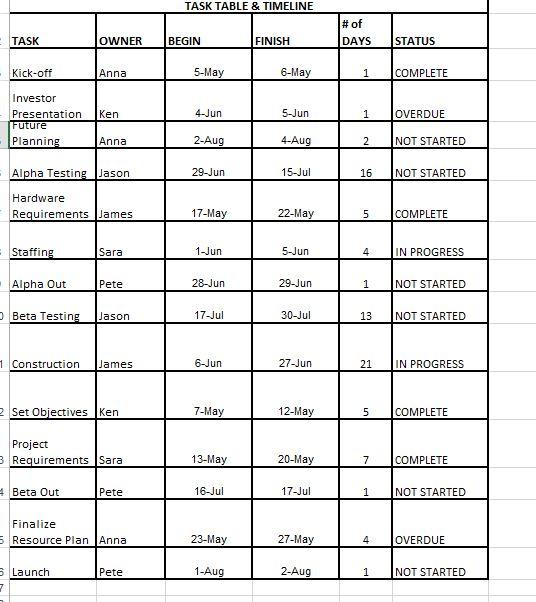
TASK TABLE \& TIMELINE TASK TABLE \& TIMELINE
Step by Step Solution
There are 3 Steps involved in it
1 Expert Approved Answer
Step: 1 Unlock

Question Has Been Solved by an Expert!
Get step-by-step solutions from verified subject matter experts
Step: 2 Unlock
Step: 3 Unlock